Hmong vs Immigrants from Somalia Self-Care Disability
COMPARE
Hmong
Immigrants from Somalia
Self-Care Disability
Self-Care Disability Comparison
Hmong
Immigrants from Somalia
2.4%
SELF-CARE DISABILITY
89.9/ 100
METRIC RATING
126th/ 347
METRIC RANK
2.5%
SELF-CARE DISABILITY
55.9/ 100
METRIC RATING
169th/ 347
METRIC RANK
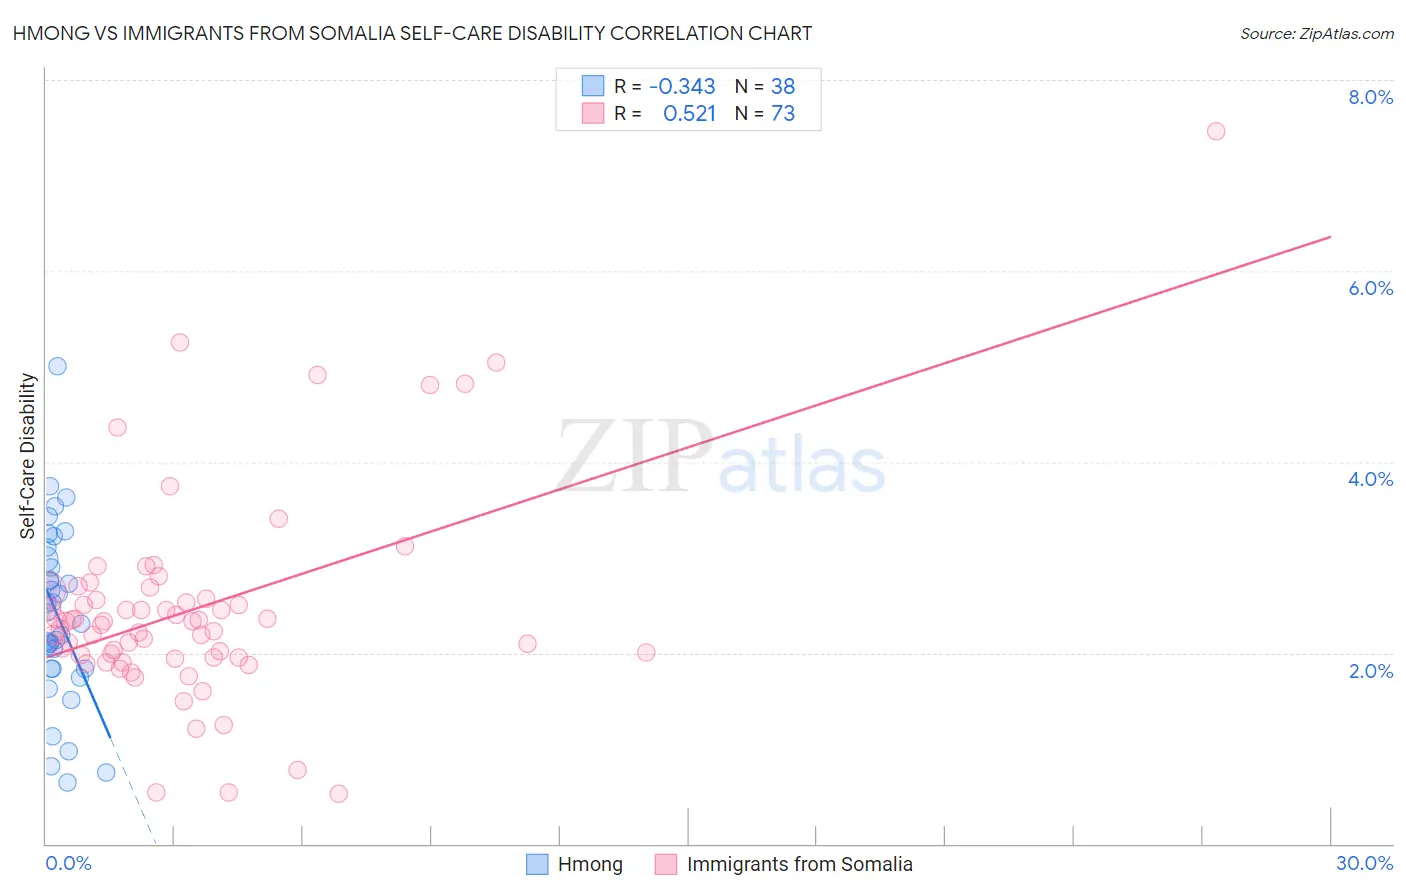
Hmong vs Immigrants from Somalia Self-Care Disability Correlation Chart
The statistical analysis conducted on geographies consisting of 24,680,008 people shows a mild negative correlation between the proportion of Hmong and percentage of population with self-care disability in the United States with a correlation coefficient (R) of -0.343 and weighted average of 2.4%. Similarly, the statistical analysis conducted on geographies consisting of 92,092,115 people shows a substantial positive correlation between the proportion of Immigrants from Somalia and percentage of population with self-care disability in the United States with a correlation coefficient (R) of 0.521 and weighted average of 2.5%, a difference of 2.4%.
Self-Care Disability Correlation Summary
| Measurement | Hmong | Immigrants from Somalia |
| Minimum | 0.65% | 0.52% |
| Maximum | 5.0% | 7.5% |
| Range | 4.4% | 6.9% |
| Mean | 2.4% | 2.5% |
| Median | 2.4% | 2.3% |
| Interquartile 25% (IQ1) | 1.8% | 2.0% |
| Interquartile 75% (IQ3) | 3.0% | 2.6% |
| Interquartile Range (IQR) | 1.1% | 0.66% |
| Standard Deviation (Sample) | 0.92% | 1.1% |
| Standard Deviation (Population) | 0.91% | 1.1% |
Similar Demographics by Self-Care Disability
Demographics Similar to Hmong by Self-Care Disability
In terms of self-care disability, the demographic groups most similar to Hmong are Colombian (2.4%, a difference of 0.030%), Immigrants from Morocco (2.4%, a difference of 0.040%), Immigrants from North America (2.4%, a difference of 0.040%), Immigrants from Hungary (2.4%, a difference of 0.040%), and Immigrants from Nigeria (2.4%, a difference of 0.050%).
| Demographics | Rating | Rank | Self-Care Disability |
| Immigrants | Sierra Leone | 91.8 /100 | #119 | Exceptional 2.4% |
| Uruguayans | 91.5 /100 | #120 | Exceptional 2.4% |
| Peruvians | 91.3 /100 | #121 | Exceptional 2.4% |
| Belgians | 90.9 /100 | #122 | Exceptional 2.4% |
| Immigrants | Nigeria | 90.3 /100 | #123 | Exceptional 2.4% |
| Immigrants | Morocco | 90.2 /100 | #124 | Exceptional 2.4% |
| Immigrants | North America | 90.2 /100 | #124 | Exceptional 2.4% |
| Hmong | 89.9 /100 | #126 | Excellent 2.4% |
| Colombians | 89.7 /100 | #127 | Excellent 2.4% |
| Immigrants | Hungary | 89.6 /100 | #128 | Excellent 2.4% |
| Immigrants | Romania | 89.3 /100 | #129 | Excellent 2.4% |
| Immigrants | Austria | 89.0 /100 | #130 | Excellent 2.4% |
| Poles | 88.9 /100 | #131 | Excellent 2.4% |
| Immigrants | South America | 88.8 /100 | #132 | Excellent 2.4% |
| Immigrants | Colombia | 88.5 /100 | #133 | Excellent 2.4% |
Demographics Similar to Immigrants from Somalia by Self-Care Disability
In terms of self-care disability, the demographic groups most similar to Immigrants from Somalia are Ute (2.5%, a difference of 0.060%), Immigrants from Greece (2.5%, a difference of 0.070%), Scottish (2.5%, a difference of 0.080%), Pennsylvania German (2.5%, a difference of 0.11%), and Czechoslovakian (2.5%, a difference of 0.12%).
| Demographics | Rating | Rank | Self-Care Disability |
| Somalis | 63.7 /100 | #162 | Good 2.5% |
| German Russians | 62.7 /100 | #163 | Good 2.5% |
| Immigrants | Vietnam | 59.3 /100 | #164 | Average 2.5% |
| Syrians | 59.0 /100 | #165 | Average 2.5% |
| Canadians | 58.8 /100 | #166 | Average 2.5% |
| Immigrants | Greece | 57.3 /100 | #167 | Average 2.5% |
| Ute | 57.1 /100 | #168 | Average 2.5% |
| Immigrants | Somalia | 55.9 /100 | #169 | Average 2.5% |
| Scottish | 54.3 /100 | #170 | Average 2.5% |
| Pennsylvania Germans | 53.5 /100 | #171 | Average 2.5% |
| Czechoslovakians | 53.5 /100 | #172 | Average 2.5% |
| Immigrants | Burma/Myanmar | 52.8 /100 | #173 | Average 2.5% |
| Welsh | 50.0 /100 | #174 | Average 2.5% |
| Immigrants | Bosnia and Herzegovina | 49.6 /100 | #175 | Average 2.5% |
| Immigrants | Afghanistan | 47.6 /100 | #176 | Average 2.5% |