Hmong vs Dutch Disability Age 18 to 34
COMPARE
Hmong
Dutch
Disability Age 18 to 34
Disability Age 18 to 34 Comparison
Hmong
Dutch
8.1%
DISABILITY AGE 18 TO 34
0.0/ 100
METRIC RATING
317th/ 347
METRIC RANK
7.7%
DISABILITY AGE 18 TO 34
0.0/ 100
METRIC RATING
298th/ 347
METRIC RANK
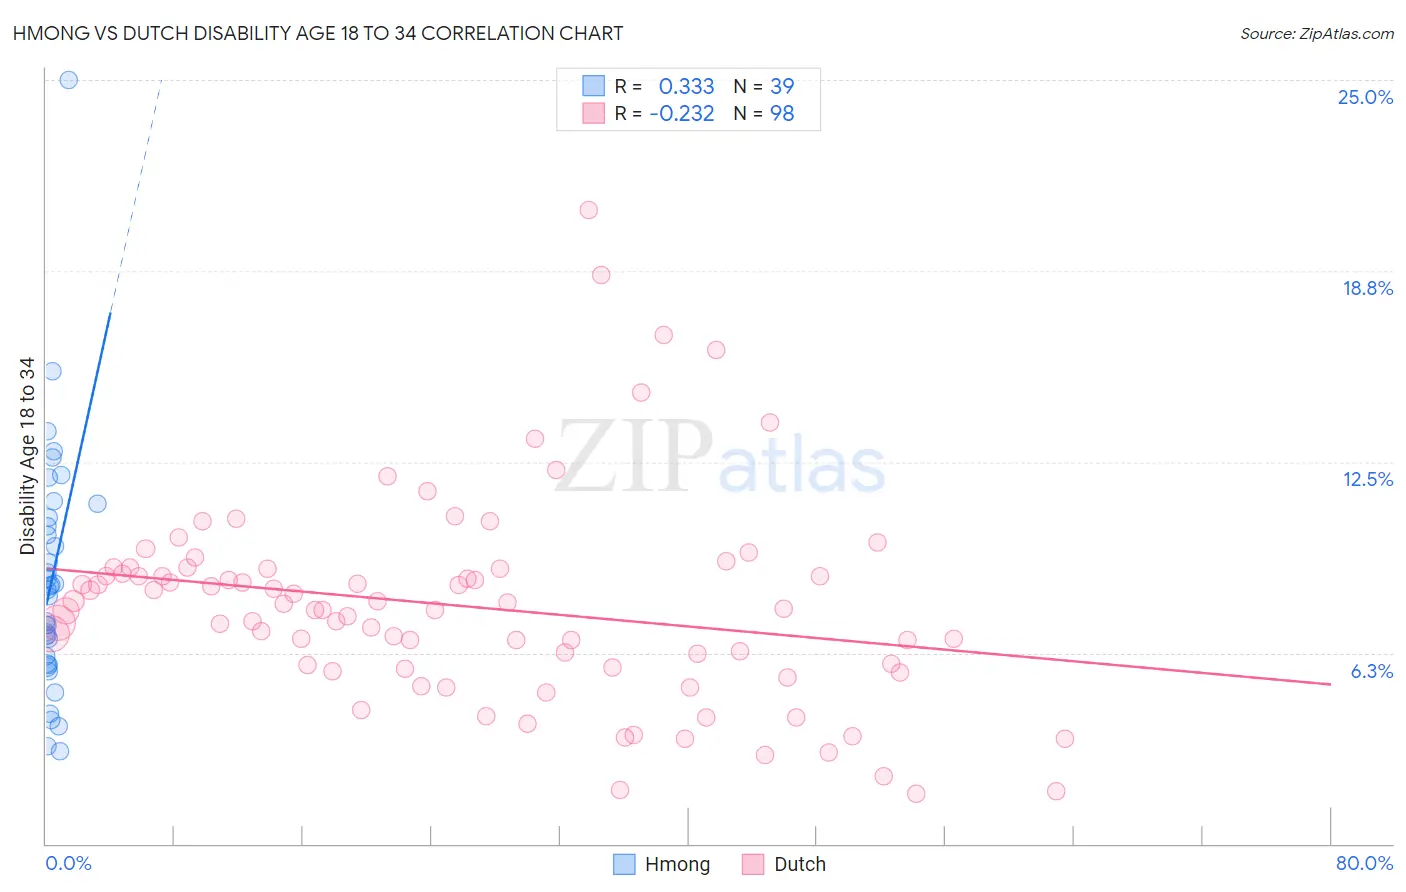
Hmong vs Dutch Disability Age 18 to 34 Correlation Chart
The statistical analysis conducted on geographies consisting of 24,681,034 people shows a mild positive correlation between the proportion of Hmong and percentage of population with a disability between the ages 18 and 35 in the United States with a correlation coefficient (R) of 0.333 and weighted average of 8.1%. Similarly, the statistical analysis conducted on geographies consisting of 549,561,766 people shows a weak negative correlation between the proportion of Dutch and percentage of population with a disability between the ages 18 and 35 in the United States with a correlation coefficient (R) of -0.232 and weighted average of 7.7%, a difference of 4.4%.
Disability Age 18 to 34 Correlation Summary
| Measurement | Hmong | Dutch |
| Minimum | 3.0% | 1.6% |
| Maximum | 25.0% | 20.7% |
| Range | 22.0% | 19.1% |
| Mean | 8.6% | 7.8% |
| Median | 8.3% | 7.7% |
| Interquartile 25% (IQ1) | 5.9% | 5.8% |
| Interquartile 75% (IQ3) | 10.7% | 9.0% |
| Interquartile Range (IQR) | 4.8% | 3.2% |
| Standard Deviation (Sample) | 4.0% | 3.4% |
| Standard Deviation (Population) | 4.0% | 3.3% |
Demographics Similar to Hmong and Dutch by Disability Age 18 to 34
In terms of disability age 18 to 34, the demographic groups most similar to Hmong are Puerto Rican (8.0%, a difference of 0.46%), American (8.0%, a difference of 0.72%), Colville (7.9%, a difference of 1.4%), Iroquois (7.9%, a difference of 1.9%), and Spanish American (7.9%, a difference of 1.9%). Similarly, the demographic groups most similar to Dutch are Pueblo (7.7%, a difference of 0.080%), German (7.7%, a difference of 0.24%), Scottish (7.7%, a difference of 0.25%), Pima (7.7%, a difference of 0.31%), and Welsh (7.7%, a difference of 0.39%).
| Demographics | Rating | Rank | Disability Age 18 to 34 |
| Pueblo | 0.0 /100 | #297 | Tragic 7.7% |
| Dutch | 0.0 /100 | #298 | Tragic 7.7% |
| Germans | 0.0 /100 | #299 | Tragic 7.7% |
| Scottish | 0.0 /100 | #300 | Tragic 7.7% |
| Pima | 0.0 /100 | #301 | Tragic 7.7% |
| Welsh | 0.0 /100 | #302 | Tragic 7.7% |
| Cheyenne | 0.0 /100 | #303 | Tragic 7.7% |
| Shoshone | 0.0 /100 | #304 | Tragic 7.8% |
| Menominee | 0.0 /100 | #305 | Tragic 7.8% |
| English | 0.0 /100 | #306 | Tragic 7.8% |
| Scotch-Irish | 0.0 /100 | #307 | Tragic 7.8% |
| Pennsylvania Germans | 0.0 /100 | #308 | Tragic 7.8% |
| Alaska Natives | 0.0 /100 | #309 | Tragic 7.8% |
| Finns | 0.0 /100 | #310 | Tragic 7.8% |
| French | 0.0 /100 | #311 | Tragic 7.9% |
| Spanish Americans | 0.0 /100 | #312 | Tragic 7.9% |
| Iroquois | 0.0 /100 | #313 | Tragic 7.9% |
| Colville | 0.0 /100 | #314 | Tragic 7.9% |
| Americans | 0.0 /100 | #315 | Tragic 8.0% |
| Puerto Ricans | 0.0 /100 | #316 | Tragic 8.0% |
| Hmong | 0.0 /100 | #317 | Tragic 8.1% |