Hmong vs Immigrants from Austria Disability Age Under 5
COMPARE
Hmong
Immigrants from Austria
Disability Age Under 5
Disability Age Under 5 Comparison
Hmong
Immigrants from Austria
1.1%
DISABILITY AGE UNDER 5
98.0/ 100
METRIC RATING
79th/ 347
METRIC RANK
1.3%
DISABILITY AGE UNDER 5
2.3/ 100
METRIC RATING
239th/ 347
METRIC RANK
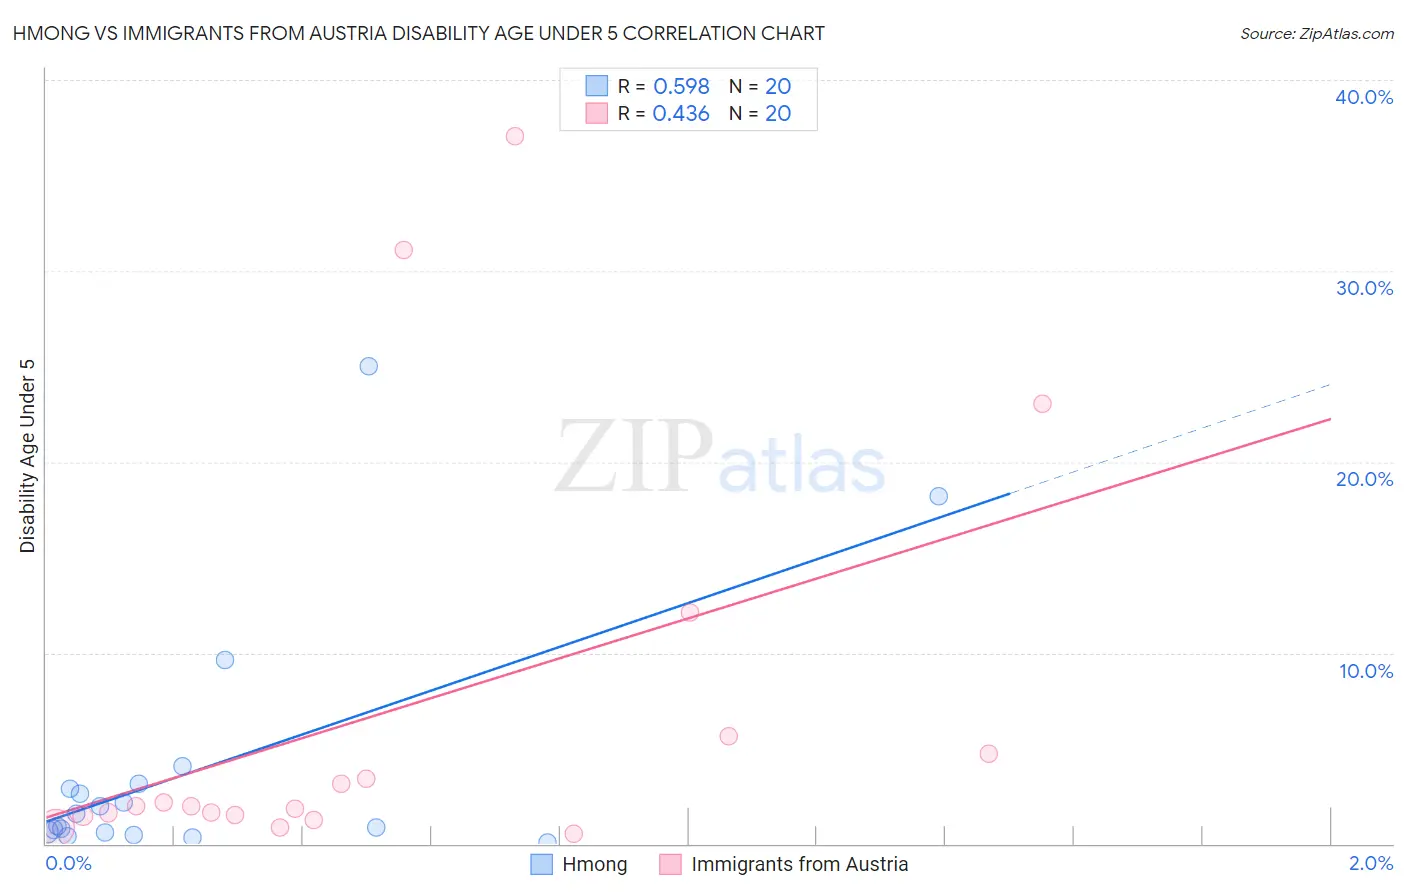
Hmong vs Immigrants from Austria Disability Age Under 5 Correlation Chart
The statistical analysis conducted on geographies consisting of 22,687,572 people shows a substantial positive correlation between the proportion of Hmong and percentage of population with a disability under the age of 5 in the United States with a correlation coefficient (R) of 0.598 and weighted average of 1.1%. Similarly, the statistical analysis conducted on geographies consisting of 111,174,092 people shows a moderate positive correlation between the proportion of Immigrants from Austria and percentage of population with a disability under the age of 5 in the United States with a correlation coefficient (R) of 0.436 and weighted average of 1.3%, a difference of 19.0%.
Disability Age Under 5 Correlation Summary
| Measurement | Hmong | Immigrants from Austria |
| Minimum | 0.097% | 0.55% |
| Maximum | 25.0% | 37.0% |
| Range | 24.9% | 36.5% |
| Mean | 3.9% | 6.9% |
| Median | 1.3% | 2.0% |
| Interquartile 25% (IQ1) | 0.61% | 1.5% |
| Interquartile 75% (IQ3) | 3.0% | 5.2% |
| Interquartile Range (IQR) | 2.4% | 3.7% |
| Standard Deviation (Sample) | 6.5% | 10.7% |
| Standard Deviation (Population) | 6.4% | 10.4% |
Similar Demographics by Disability Age Under 5
Demographics Similar to Hmong by Disability Age Under 5
In terms of disability age under 5, the demographic groups most similar to Hmong are West Indian (1.1%, a difference of 0.020%), Immigrants from Trinidad and Tobago (1.1%, a difference of 0.020%), Turkish (1.1%, a difference of 0.040%), Immigrants from Denmark (1.1%, a difference of 0.14%), and Immigrants from Jordan (1.1%, a difference of 0.16%).
| Demographics | Rating | Rank | Disability Age Under 5 |
| Burmese | 98.5 /100 | #72 | Exceptional 1.1% |
| Immigrants | Sri Lanka | 98.5 /100 | #73 | Exceptional 1.1% |
| Jordanians | 98.5 /100 | #74 | Exceptional 1.1% |
| Immigrants | Pakistan | 98.4 /100 | #75 | Exceptional 1.1% |
| Immigrants | Burma/Myanmar | 98.2 /100 | #76 | Exceptional 1.1% |
| Immigrants | Denmark | 98.1 /100 | #77 | Exceptional 1.1% |
| West Indians | 98.0 /100 | #78 | Exceptional 1.1% |
| Hmong | 98.0 /100 | #79 | Exceptional 1.1% |
| Immigrants | Trinidad and Tobago | 98.0 /100 | #80 | Exceptional 1.1% |
| Turks | 98.0 /100 | #81 | Exceptional 1.1% |
| Immigrants | Jordan | 97.9 /100 | #82 | Exceptional 1.1% |
| Immigrants | Syria | 97.9 /100 | #83 | Exceptional 1.1% |
| Immigrants | Zaire | 97.8 /100 | #84 | Exceptional 1.1% |
| Sudanese | 97.7 /100 | #85 | Exceptional 1.1% |
| Okinawans | 97.6 /100 | #86 | Exceptional 1.1% |
Demographics Similar to Immigrants from Austria by Disability Age Under 5
In terms of disability age under 5, the demographic groups most similar to Immigrants from Austria are Native Hawaiian (1.3%, a difference of 0.020%), Maltese (1.3%, a difference of 0.090%), Spanish American Indian (1.3%, a difference of 0.16%), Lumbee (1.3%, a difference of 0.18%), and Immigrants from Cameroon (1.4%, a difference of 0.56%).
| Demographics | Rating | Rank | Disability Age Under 5 |
| French American Indians | 4.5 /100 | #232 | Tragic 1.3% |
| Tongans | 4.2 /100 | #233 | Tragic 1.3% |
| Pueblo | 3.8 /100 | #234 | Tragic 1.3% |
| Central American Indians | 3.6 /100 | #235 | Tragic 1.3% |
| South American Indians | 3.3 /100 | #236 | Tragic 1.3% |
| Basques | 3.0 /100 | #237 | Tragic 1.3% |
| Spanish American Indians | 2.4 /100 | #238 | Tragic 1.3% |
| Immigrants | Austria | 2.3 /100 | #239 | Tragic 1.3% |
| Native Hawaiians | 2.2 /100 | #240 | Tragic 1.3% |
| Maltese | 2.2 /100 | #241 | Tragic 1.3% |
| Lumbee | 2.1 /100 | #242 | Tragic 1.3% |
| Immigrants | Cameroon | 1.7 /100 | #243 | Tragic 1.4% |
| Spaniards | 1.4 /100 | #244 | Tragic 1.4% |
| Potawatomi | 1.1 /100 | #245 | Tragic 1.4% |
| Russians | 1.0 /100 | #246 | Tragic 1.4% |