Hawaiian vs Eastern European Female Disability
COMPARE
Hawaiian
Eastern European
Female Disability
Female Disability Comparison
Hawaiians
Eastern Europeans
12.7%
FEMALE DISABILITY
1.4/ 100
METRIC RATING
254th/ 347
METRIC RANK
11.5%
FEMALE DISABILITY
99.7/ 100
METRIC RATING
81st/ 347
METRIC RANK
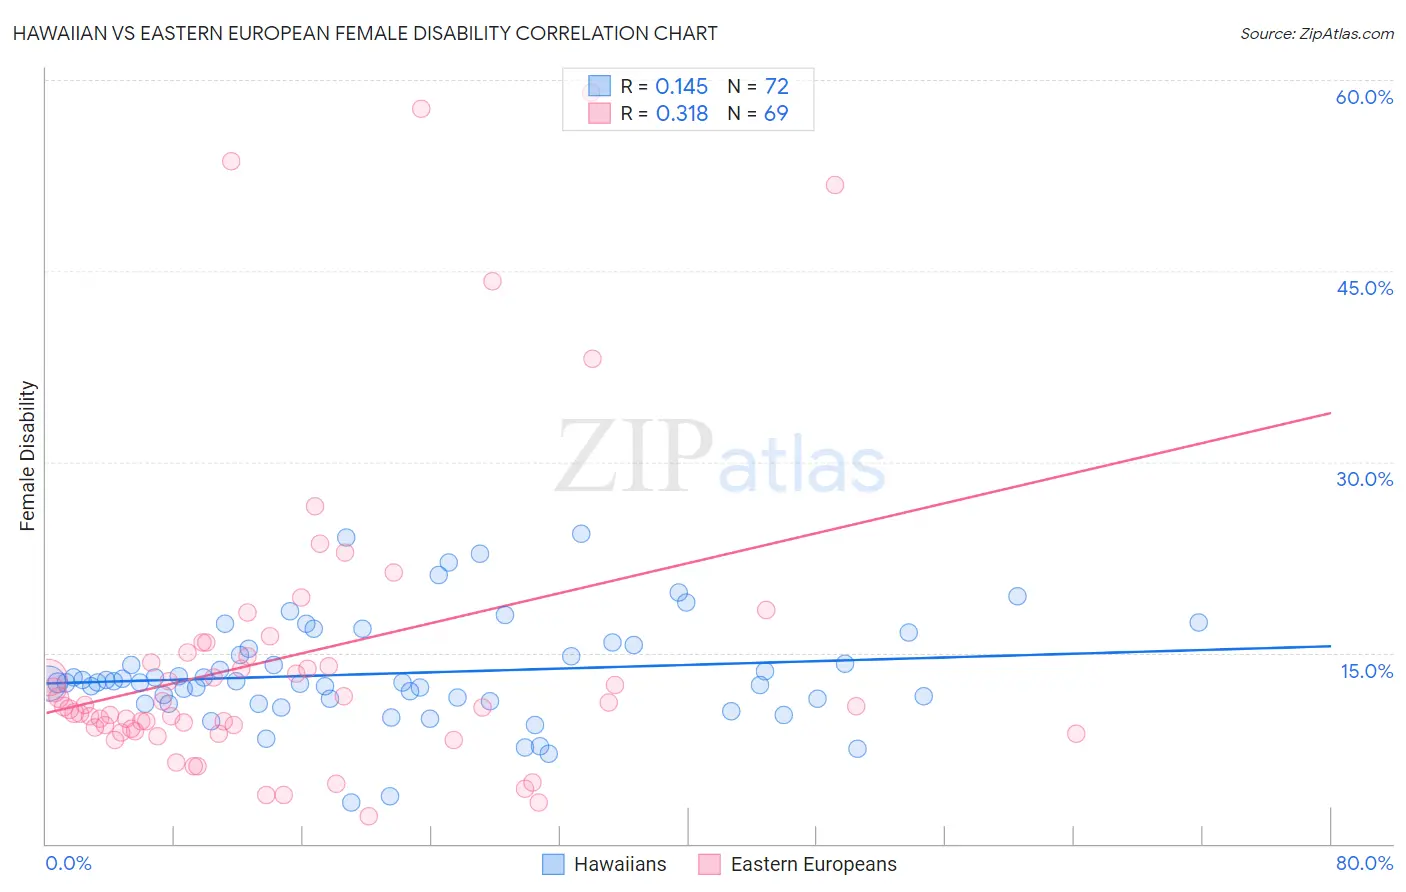
Hawaiian vs Eastern European Female Disability Correlation Chart
The statistical analysis conducted on geographies consisting of 327,480,697 people shows a poor positive correlation between the proportion of Hawaiians and percentage of females with a disability in the United States with a correlation coefficient (R) of 0.145 and weighted average of 12.7%. Similarly, the statistical analysis conducted on geographies consisting of 461,176,022 people shows a mild positive correlation between the proportion of Eastern Europeans and percentage of females with a disability in the United States with a correlation coefficient (R) of 0.318 and weighted average of 11.5%, a difference of 9.9%.
Female Disability Correlation Summary
| Measurement | Hawaiian | Eastern European |
| Minimum | 3.3% | 2.2% |
| Maximum | 24.3% | 59.0% |
| Range | 21.1% | 56.8% |
| Mean | 13.4% | 14.7% |
| Median | 12.7% | 10.8% |
| Interquartile 25% (IQ1) | 11.3% | 8.9% |
| Interquartile 75% (IQ3) | 15.5% | 14.8% |
| Interquartile Range (IQR) | 4.2% | 5.9% |
| Standard Deviation (Sample) | 4.1% | 12.3% |
| Standard Deviation (Population) | 4.1% | 12.2% |
Similar Demographics by Female Disability
Demographics Similar to Hawaiians by Female Disability
In terms of female disability, the demographic groups most similar to Hawaiians are Jamaican (12.7%, a difference of 0.030%), Immigrants from Caribbean (12.7%, a difference of 0.040%), Immigrants from Germany (12.7%, a difference of 0.080%), Crow (12.7%, a difference of 0.12%), and British West Indian (12.7%, a difference of 0.15%).
| Demographics | Rating | Rank | Female Disability |
| Menominee | 2.1 /100 | #247 | Tragic 12.6% |
| Carpatho Rusyns | 2.0 /100 | #248 | Tragic 12.6% |
| Immigrants | Congo | 1.8 /100 | #249 | Tragic 12.7% |
| Slovenes | 1.7 /100 | #250 | Tragic 12.7% |
| Crow | 1.6 /100 | #251 | Tragic 12.7% |
| Immigrants | Caribbean | 1.4 /100 | #252 | Tragic 12.7% |
| Jamaicans | 1.4 /100 | #253 | Tragic 12.7% |
| Hawaiians | 1.4 /100 | #254 | Tragic 12.7% |
| Immigrants | Germany | 1.3 /100 | #255 | Tragic 12.7% |
| British West Indians | 1.2 /100 | #256 | Tragic 12.7% |
| Liberians | 1.1 /100 | #257 | Tragic 12.7% |
| Aleuts | 1.1 /100 | #258 | Tragic 12.7% |
| Immigrants | Armenia | 1.0 /100 | #259 | Tragic 12.7% |
| Sub-Saharan Africans | 1.0 /100 | #260 | Tragic 12.7% |
| Bermudans | 1.0 /100 | #261 | Tragic 12.7% |
Demographics Similar to Eastern Europeans by Female Disability
In terms of female disability, the demographic groups most similar to Eastern Europeans are Immigrants from Jordan (11.5%, a difference of 0.14%), Sierra Leonean (11.5%, a difference of 0.15%), Immigrants from South Africa (11.5%, a difference of 0.17%), Immigrants from Eritrea (11.5%, a difference of 0.18%), and Immigrants from Afghanistan (11.5%, a difference of 0.18%).
| Demographics | Rating | Rank | Female Disability |
| Bhutanese | 99.8 /100 | #74 | Exceptional 11.5% |
| Immigrants | Lebanon | 99.7 /100 | #75 | Exceptional 11.5% |
| Immigrants | Eritrea | 99.7 /100 | #76 | Exceptional 11.5% |
| Immigrants | Afghanistan | 99.7 /100 | #77 | Exceptional 11.5% |
| Immigrants | South Africa | 99.7 /100 | #78 | Exceptional 11.5% |
| Sierra Leoneans | 99.7 /100 | #79 | Exceptional 11.5% |
| Immigrants | Jordan | 99.7 /100 | #80 | Exceptional 11.5% |
| Eastern Europeans | 99.7 /100 | #81 | Exceptional 11.5% |
| Luxembourgers | 99.6 /100 | #82 | Exceptional 11.6% |
| Immigrants | Serbia | 99.6 /100 | #83 | Exceptional 11.6% |
| Immigrants | Poland | 99.6 /100 | #84 | Exceptional 11.6% |
| Palestinians | 99.6 /100 | #85 | Exceptional 11.6% |
| Immigrants | Cameroon | 99.6 /100 | #86 | Exceptional 11.6% |
| Immigrants | Denmark | 99.5 /100 | #87 | Exceptional 11.6% |
| Yup'ik | 99.5 /100 | #88 | Exceptional 11.6% |