Hawaiian vs Mongolian Female Poverty Among 25-34 Year Olds
COMPARE
Hawaiian
Mongolian
Female Poverty Among 25-34 Year Olds
Female Poverty Among 25-34 Year Olds Comparison
Hawaiians
Mongolians
14.1%
FEMALE POVERTY AMONG 25-34 YEAR OLDS
13.6/ 100
METRIC RATING
204th/ 347
METRIC RANK
12.8%
FEMALE POVERTY AMONG 25-34 YEAR OLDS
93.0/ 100
METRIC RATING
118th/ 347
METRIC RANK
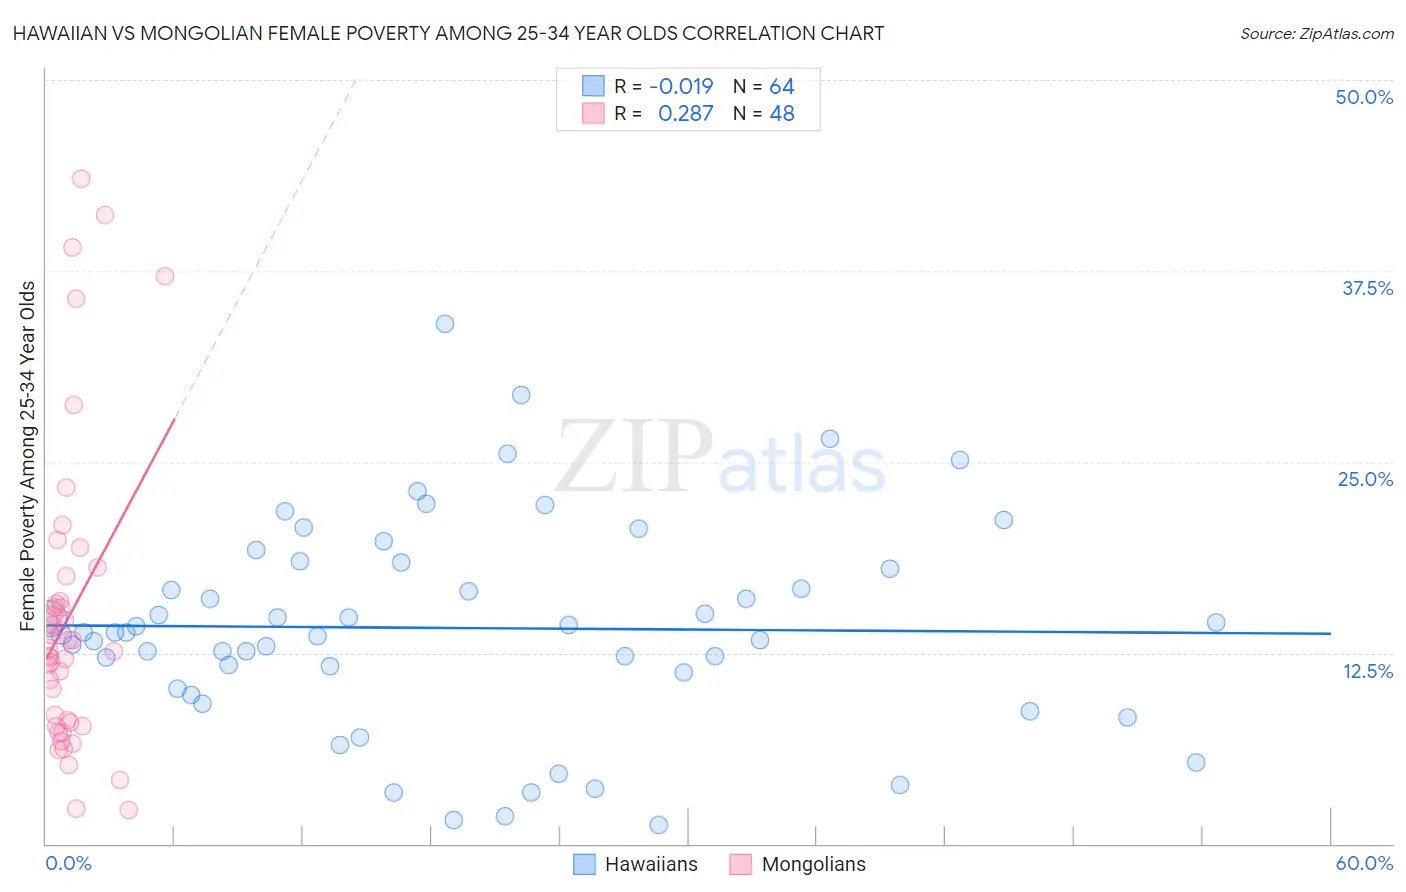
Hawaiian vs Mongolian Female Poverty Among 25-34 Year Olds Correlation Chart
The statistical analysis conducted on geographies consisting of 324,442,153 people shows no correlation between the proportion of Hawaiians and poverty level among females between the ages 25 and 34 in the United States with a correlation coefficient (R) of -0.019 and weighted average of 14.1%. Similarly, the statistical analysis conducted on geographies consisting of 139,569,877 people shows a weak positive correlation between the proportion of Mongolians and poverty level among females between the ages 25 and 34 in the United States with a correlation coefficient (R) of 0.287 and weighted average of 12.8%, a difference of 9.8%.
Female Poverty Among 25-34 Year Olds Correlation Summary
| Measurement | Hawaiian | Mongolian |
| Minimum | 1.2% | 2.2% |
| Maximum | 34.1% | 43.5% |
| Range | 32.8% | 41.3% |
| Mean | 14.1% | 14.9% |
| Median | 13.8% | 12.7% |
| Interquartile 25% (IQ1) | 10.7% | 7.8% |
| Interquartile 75% (IQ3) | 18.2% | 16.7% |
| Interquartile Range (IQR) | 7.5% | 8.9% |
| Standard Deviation (Sample) | 6.8% | 10.0% |
| Standard Deviation (Population) | 6.8% | 9.9% |
Similar Demographics by Female Poverty Among 25-34 Year Olds
Demographics Similar to Hawaiians by Female Poverty Among 25-34 Year Olds
In terms of female poverty among 25-34 year olds, the demographic groups most similar to Hawaiians are Immigrants from Africa (14.1%, a difference of 0.050%), Immigrants (14.0%, a difference of 0.15%), Hungarian (14.1%, a difference of 0.33%), Japanese (14.1%, a difference of 0.35%), and Immigrants from Panama (14.1%, a difference of 0.37%).
| Demographics | Rating | Rank | Female Poverty Among 25-34 Year Olds |
| Immigrants | Saudi Arabia | 21.9 /100 | #197 | Fair 13.9% |
| Immigrants | Germany | 20.9 /100 | #198 | Fair 13.9% |
| English | 20.4 /100 | #199 | Fair 13.9% |
| Hmong | 20.3 /100 | #200 | Fair 13.9% |
| Immigrants | Trinidad and Tobago | 17.6 /100 | #201 | Poor 14.0% |
| Welsh | 17.2 /100 | #202 | Poor 14.0% |
| Immigrants | Immigrants | 14.5 /100 | #203 | Poor 14.0% |
| Hawaiians | 13.6 /100 | #204 | Poor 14.1% |
| Immigrants | Africa | 13.4 /100 | #205 | Poor 14.1% |
| Hungarians | 11.8 /100 | #206 | Poor 14.1% |
| Japanese | 11.7 /100 | #207 | Poor 14.1% |
| Immigrants | Panama | 11.6 /100 | #208 | Poor 14.1% |
| Guyanese | 8.6 /100 | #209 | Tragic 14.2% |
| Panamanians | 8.6 /100 | #210 | Tragic 14.2% |
| Trinidadians and Tobagonians | 8.2 /100 | #211 | Tragic 14.2% |
Demographics Similar to Mongolians by Female Poverty Among 25-34 Year Olds
In terms of female poverty among 25-34 year olds, the demographic groups most similar to Mongolians are Immigrants from Kuwait (12.8%, a difference of 0.010%), Immigrants from Nepal (12.8%, a difference of 0.010%), Carpatho Rusyn (12.8%, a difference of 0.010%), Chilean (12.8%, a difference of 0.070%), and Romanian (12.8%, a difference of 0.080%).
| Demographics | Rating | Rank | Female Poverty Among 25-34 Year Olds |
| Danes | 93.9 /100 | #111 | Exceptional 12.8% |
| Immigrants | Morocco | 93.9 /100 | #112 | Exceptional 12.8% |
| Immigrants | Syria | 93.8 /100 | #113 | Exceptional 12.8% |
| Immigrants | Southern Europe | 93.6 /100 | #114 | Exceptional 12.8% |
| Immigrants | Brazil | 93.3 /100 | #115 | Exceptional 12.8% |
| Chileans | 93.2 /100 | #116 | Exceptional 12.8% |
| Immigrants | Kuwait | 93.1 /100 | #117 | Exceptional 12.8% |
| Mongolians | 93.0 /100 | #118 | Exceptional 12.8% |
| Immigrants | Nepal | 93.0 /100 | #119 | Exceptional 12.8% |
| Carpatho Rusyns | 93.0 /100 | #120 | Exceptional 12.8% |
| Romanians | 92.8 /100 | #121 | Exceptional 12.8% |
| Immigrants | Western Asia | 92.7 /100 | #122 | Exceptional 12.8% |
| Slovenes | 92.7 /100 | #123 | Exceptional 12.8% |
| Immigrants | Netherlands | 92.0 /100 | #124 | Exceptional 12.8% |
| Immigrants | Canada | 91.5 /100 | #125 | Exceptional 12.9% |