Hawaiian vs Nepalese Ambulatory Disability
COMPARE
Hawaiian
Nepalese
Ambulatory Disability
Ambulatory Disability Comparison
Hawaiians
Nepalese
6.5%
AMBULATORY DISABILITY
0.9/ 100
METRIC RATING
251st/ 347
METRIC RANK
6.6%
AMBULATORY DISABILITY
0.2/ 100
METRIC RATING
264th/ 347
METRIC RANK
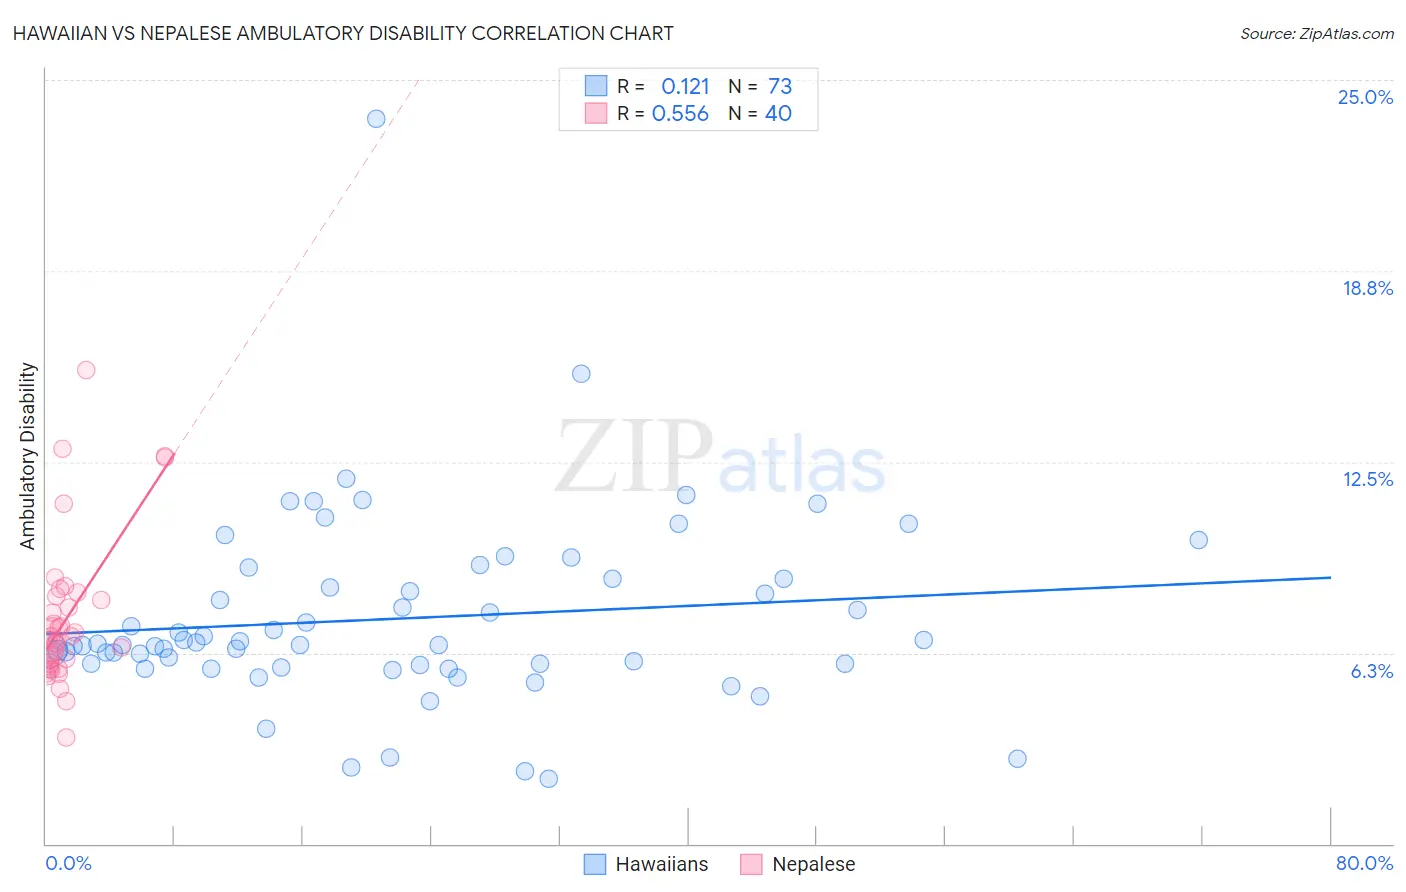
Hawaiian vs Nepalese Ambulatory Disability Correlation Chart
The statistical analysis conducted on geographies consisting of 327,430,219 people shows a poor positive correlation between the proportion of Hawaiians and percentage of population with ambulatory disability in the United States with a correlation coefficient (R) of 0.121 and weighted average of 6.5%. Similarly, the statistical analysis conducted on geographies consisting of 24,521,755 people shows a substantial positive correlation between the proportion of Nepalese and percentage of population with ambulatory disability in the United States with a correlation coefficient (R) of 0.556 and weighted average of 6.6%, a difference of 1.7%.
Ambulatory Disability Correlation Summary
| Measurement | Hawaiian | Nepalese |
| Minimum | 2.1% | 3.5% |
| Maximum | 23.7% | 15.5% |
| Range | 21.6% | 12.0% |
| Mean | 7.4% | 7.4% |
| Median | 6.5% | 6.7% |
| Interquartile 25% (IQ1) | 5.9% | 5.9% |
| Interquartile 75% (IQ3) | 8.7% | 8.0% |
| Interquartile Range (IQR) | 2.8% | 2.2% |
| Standard Deviation (Sample) | 3.1% | 2.4% |
| Standard Deviation (Population) | 3.1% | 2.4% |
Demographics Similar to Hawaiians and Nepalese by Ambulatory Disability
In terms of ambulatory disability, the demographic groups most similar to Hawaiians are Chinese (6.5%, a difference of 0.18%), Immigrants from Bahamas (6.5%, a difference of 0.20%), Scottish (6.5%, a difference of 0.25%), Native Hawaiian (6.5%, a difference of 0.26%), and Belizean (6.5%, a difference of 0.41%). Similarly, the demographic groups most similar to Nepalese are Bahamian (6.6%, a difference of 0.060%), Guyanese (6.6%, a difference of 0.18%), Trinidadian and Tobagonian (6.6%, a difference of 0.31%), Hmong (6.6%, a difference of 0.40%), and English (6.6%, a difference of 0.52%).
| Demographics | Rating | Rank | Ambulatory Disability |
| Immigrants | Cuba | 1.4 /100 | #247 | Tragic 6.5% |
| Immigrants | Portugal | 1.4 /100 | #248 | Tragic 6.5% |
| Native Hawaiians | 1.1 /100 | #249 | Tragic 6.5% |
| Chinese | 1.0 /100 | #250 | Tragic 6.5% |
| Hawaiians | 0.9 /100 | #251 | Tragic 6.5% |
| Immigrants | Bahamas | 0.8 /100 | #252 | Tragic 6.5% |
| Scottish | 0.7 /100 | #253 | Tragic 6.5% |
| Belizeans | 0.7 /100 | #254 | Tragic 6.5% |
| Welsh | 0.6 /100 | #255 | Tragic 6.5% |
| Immigrants | Uzbekistan | 0.6 /100 | #256 | Tragic 6.5% |
| Bermudans | 0.5 /100 | #257 | Tragic 6.5% |
| Spanish American Indians | 0.5 /100 | #258 | Tragic 6.5% |
| Aleuts | 0.4 /100 | #259 | Tragic 6.6% |
| Immigrants | Belize | 0.4 /100 | #260 | Tragic 6.6% |
| Irish | 0.4 /100 | #261 | Tragic 6.6% |
| English | 0.4 /100 | #262 | Tragic 6.6% |
| Hmong | 0.3 /100 | #263 | Tragic 6.6% |
| Nepalese | 0.2 /100 | #264 | Tragic 6.6% |
| Bahamians | 0.2 /100 | #265 | Tragic 6.6% |
| Guyanese | 0.2 /100 | #266 | Tragic 6.6% |
| Trinidadians and Tobagonians | 0.2 /100 | #267 | Tragic 6.6% |