Hawaiian vs Canadian Ambulatory Disability
COMPARE
Hawaiian
Canadian
Ambulatory Disability
Ambulatory Disability Comparison
Hawaiians
Canadians
6.5%
AMBULATORY DISABILITY
0.9/ 100
METRIC RATING
251st/ 347
METRIC RANK
6.3%
AMBULATORY DISABILITY
10.9/ 100
METRIC RATING
216th/ 347
METRIC RANK
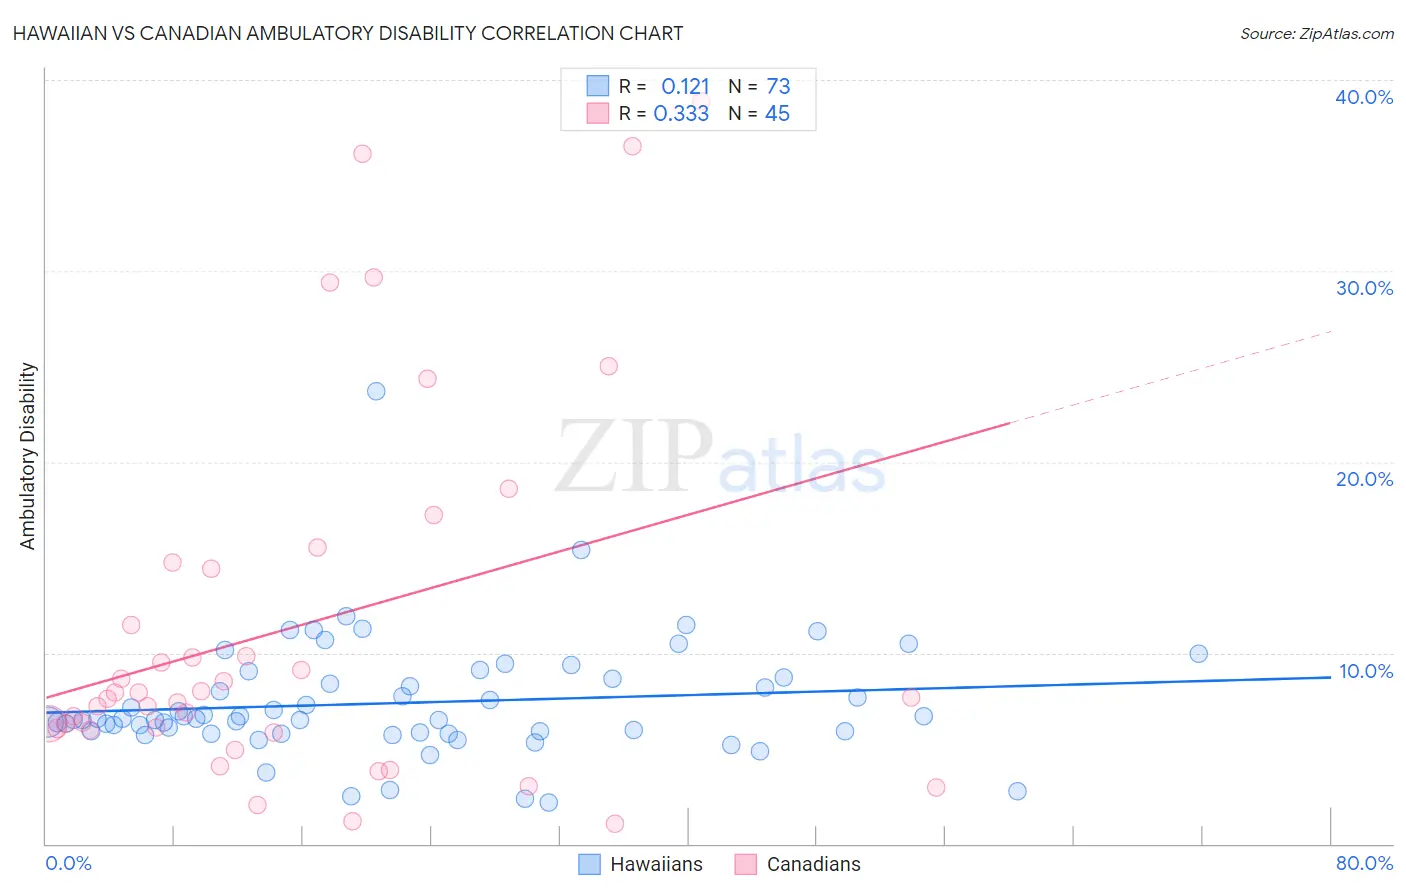
Hawaiian vs Canadian Ambulatory Disability Correlation Chart
The statistical analysis conducted on geographies consisting of 327,430,219 people shows a poor positive correlation between the proportion of Hawaiians and percentage of population with ambulatory disability in the United States with a correlation coefficient (R) of 0.121 and weighted average of 6.5%. Similarly, the statistical analysis conducted on geographies consisting of 437,391,973 people shows a mild positive correlation between the proportion of Canadians and percentage of population with ambulatory disability in the United States with a correlation coefficient (R) of 0.333 and weighted average of 6.3%, a difference of 3.3%.
Ambulatory Disability Correlation Summary
| Measurement | Hawaiian | Canadian |
| Minimum | 2.1% | 1.0% |
| Maximum | 23.7% | 38.9% |
| Range | 21.6% | 37.8% |
| Mean | 7.4% | 11.4% |
| Median | 6.5% | 7.7% |
| Interquartile 25% (IQ1) | 5.9% | 6.0% |
| Interquartile 75% (IQ3) | 8.7% | 14.6% |
| Interquartile Range (IQR) | 2.8% | 8.6% |
| Standard Deviation (Sample) | 3.1% | 9.7% |
| Standard Deviation (Population) | 3.1% | 9.6% |
Similar Demographics by Ambulatory Disability
Demographics Similar to Hawaiians by Ambulatory Disability
In terms of ambulatory disability, the demographic groups most similar to Hawaiians are Chinese (6.5%, a difference of 0.18%), Immigrants from Bahamas (6.5%, a difference of 0.20%), Scottish (6.5%, a difference of 0.25%), Native Hawaiian (6.5%, a difference of 0.26%), and Belizean (6.5%, a difference of 0.41%).
| Demographics | Rating | Rank | Ambulatory Disability |
| Immigrants | Panama | 1.5 /100 | #244 | Tragic 6.5% |
| Tlingit-Haida | 1.5 /100 | #245 | Tragic 6.5% |
| Armenians | 1.5 /100 | #246 | Tragic 6.5% |
| Immigrants | Cuba | 1.4 /100 | #247 | Tragic 6.5% |
| Immigrants | Portugal | 1.4 /100 | #248 | Tragic 6.5% |
| Native Hawaiians | 1.1 /100 | #249 | Tragic 6.5% |
| Chinese | 1.0 /100 | #250 | Tragic 6.5% |
| Hawaiians | 0.9 /100 | #251 | Tragic 6.5% |
| Immigrants | Bahamas | 0.8 /100 | #252 | Tragic 6.5% |
| Scottish | 0.7 /100 | #253 | Tragic 6.5% |
| Belizeans | 0.7 /100 | #254 | Tragic 6.5% |
| Welsh | 0.6 /100 | #255 | Tragic 6.5% |
| Immigrants | Uzbekistan | 0.6 /100 | #256 | Tragic 6.5% |
| Bermudans | 0.5 /100 | #257 | Tragic 6.5% |
| Spanish American Indians | 0.5 /100 | #258 | Tragic 6.5% |
Demographics Similar to Canadians by Ambulatory Disability
In terms of ambulatory disability, the demographic groups most similar to Canadians are Yugoslavian (6.3%, a difference of 0.0%), Immigrants from Latin America (6.3%, a difference of 0.010%), Immigrants from Mexico (6.3%, a difference of 0.020%), Guamanian/Chamorro (6.3%, a difference of 0.040%), and Mexican American Indian (6.3%, a difference of 0.14%).
| Demographics | Rating | Rank | Ambulatory Disability |
| Immigrants | Iraq | 14.0 /100 | #209 | Poor 6.3% |
| Immigrants | Laos | 13.2 /100 | #210 | Poor 6.3% |
| Samoans | 12.1 /100 | #211 | Poor 6.3% |
| Mexican American Indians | 12.0 /100 | #212 | Poor 6.3% |
| Japanese | 12.0 /100 | #213 | Poor 6.3% |
| Immigrants | Mexico | 11.0 /100 | #214 | Poor 6.3% |
| Immigrants | Latin America | 11.0 /100 | #215 | Poor 6.3% |
| Canadians | 10.9 /100 | #216 | Poor 6.3% |
| Yugoslavians | 10.9 /100 | #217 | Poor 6.3% |
| Guamanians/Chamorros | 10.6 /100 | #218 | Poor 6.3% |
| Indonesians | 9.9 /100 | #219 | Tragic 6.3% |
| Immigrants | Albania | 9.6 /100 | #220 | Tragic 6.3% |
| Hungarians | 9.6 /100 | #221 | Tragic 6.3% |
| German Russians | 9.4 /100 | #222 | Tragic 6.3% |
| Immigrants | Honduras | 7.6 /100 | #223 | Tragic 6.3% |