Haitian vs Immigrants from Bulgaria Female Disability
COMPARE
Haitian
Immigrants from Bulgaria
Female Disability
Female Disability Comparison
Haitians
Immigrants from Bulgaria
12.2%
FEMALE DISABILITY
51.9/ 100
METRIC RATING
172nd/ 347
METRIC RANK
11.4%
FEMALE DISABILITY
99.9/ 100
METRIC RATING
60th/ 347
METRIC RANK
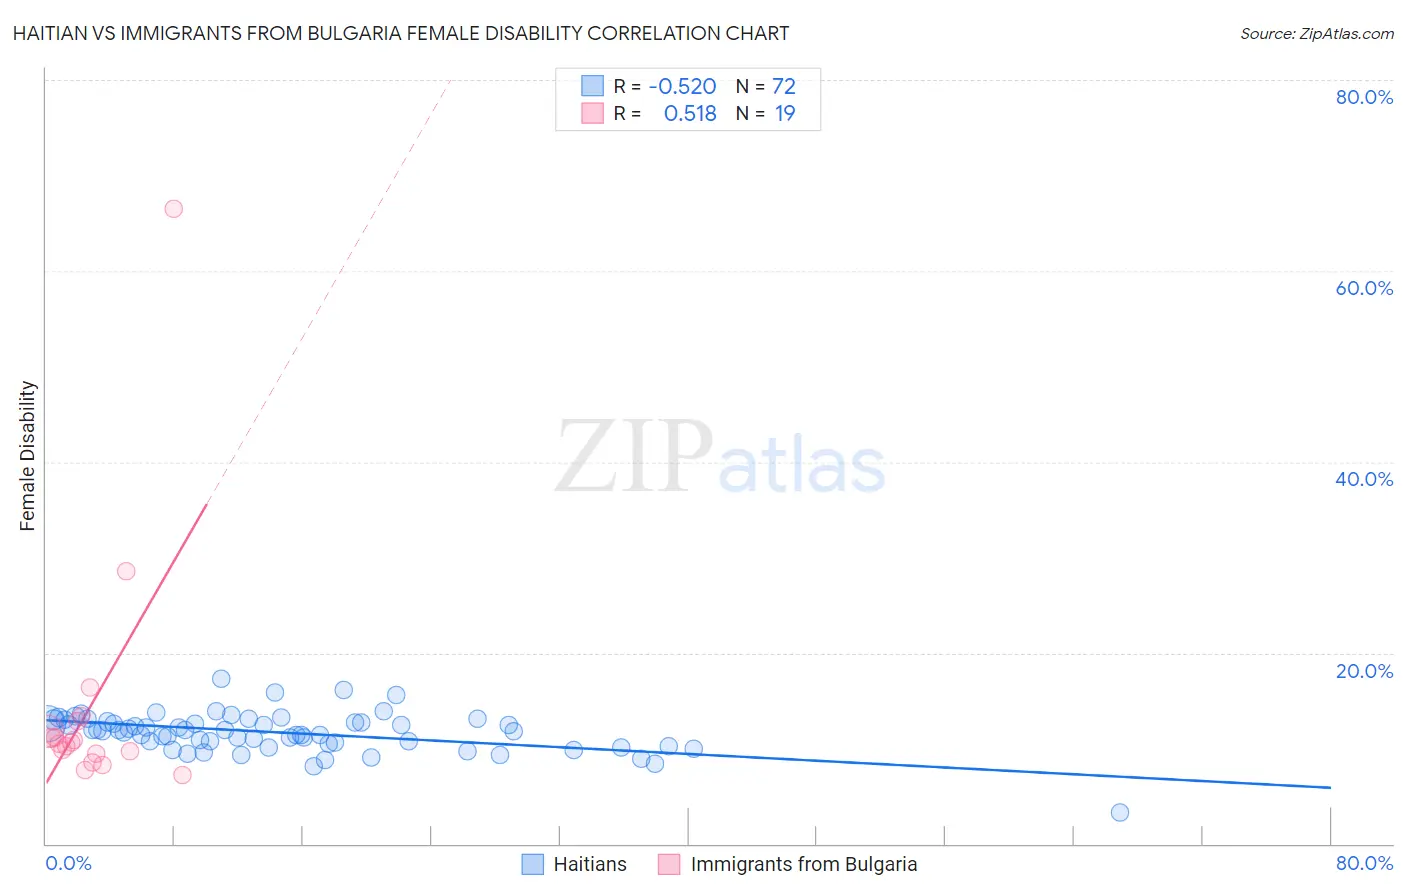
Haitian vs Immigrants from Bulgaria Female Disability Correlation Chart
The statistical analysis conducted on geographies consisting of 287,924,181 people shows a substantial negative correlation between the proportion of Haitians and percentage of females with a disability in the United States with a correlation coefficient (R) of -0.520 and weighted average of 12.2%. Similarly, the statistical analysis conducted on geographies consisting of 172,548,429 people shows a substantial positive correlation between the proportion of Immigrants from Bulgaria and percentage of females with a disability in the United States with a correlation coefficient (R) of 0.518 and weighted average of 11.4%, a difference of 6.9%.
Female Disability Correlation Summary
| Measurement | Haitian | Immigrants from Bulgaria |
| Minimum | 3.3% | 7.2% |
| Maximum | 17.2% | 66.5% |
| Range | 13.9% | 59.3% |
| Mean | 11.6% | 14.4% |
| Median | 11.9% | 10.7% |
| Interquartile 25% (IQ1) | 10.5% | 9.4% |
| Interquartile 75% (IQ3) | 12.7% | 12.9% |
| Interquartile Range (IQR) | 2.2% | 3.5% |
| Standard Deviation (Sample) | 2.0% | 13.4% |
| Standard Deviation (Population) | 2.0% | 13.1% |
Similar Demographics by Female Disability
Demographics Similar to Haitians by Female Disability
In terms of female disability, the demographic groups most similar to Haitians are Immigrants from Mexico (12.2%, a difference of 0.040%), Immigrants from England (12.2%, a difference of 0.070%), Immigrants from St. Vincent and the Grenadines (12.2%, a difference of 0.080%), Immigrants from Southern Europe (12.2%, a difference of 0.17%), and Maltese (12.2%, a difference of 0.19%).
| Demographics | Rating | Rank | Female Disability |
| Immigrants | Oceania | 61.8 /100 | #165 | Good 12.1% |
| Lithuanians | 59.5 /100 | #166 | Average 12.2% |
| Immigrants | Latin America | 59.0 /100 | #167 | Average 12.2% |
| Immigrants | Haiti | 58.8 /100 | #168 | Average 12.2% |
| Lebanese | 58.1 /100 | #169 | Average 12.2% |
| Maltese | 57.0 /100 | #170 | Average 12.2% |
| Immigrants | Southern Europe | 56.3 /100 | #171 | Average 12.2% |
| Haitians | 51.9 /100 | #172 | Average 12.2% |
| Immigrants | Mexico | 50.8 /100 | #173 | Average 12.2% |
| Immigrants | England | 50.0 /100 | #174 | Average 12.2% |
| Immigrants | St. Vincent and the Grenadines | 49.7 /100 | #175 | Average 12.2% |
| Immigrants | Guyana | 43.1 /100 | #176 | Average 12.2% |
| Immigrants | Ghana | 42.5 /100 | #177 | Average 12.2% |
| Immigrants | Western Europe | 40.9 /100 | #178 | Average 12.2% |
| Immigrants | Fiji | 38.2 /100 | #179 | Fair 12.3% |
Demographics Similar to Immigrants from Bulgaria by Female Disability
In terms of female disability, the demographic groups most similar to Immigrants from Bulgaria are Immigrants from France (11.4%, a difference of 0.060%), Immigrants from Spain (11.4%, a difference of 0.11%), Sri Lankan (11.4%, a difference of 0.15%), Laotian (11.4%, a difference of 0.25%), and Immigrants from Colombia (11.4%, a difference of 0.26%).
| Demographics | Rating | Rank | Female Disability |
| Immigrants | Saudi Arabia | 99.9 /100 | #53 | Exceptional 11.3% |
| Peruvians | 99.9 /100 | #54 | Exceptional 11.3% |
| Bulgarians | 99.9 /100 | #55 | Exceptional 11.3% |
| Taiwanese | 99.9 /100 | #56 | Exceptional 11.4% |
| South Americans | 99.9 /100 | #57 | Exceptional 11.4% |
| Laotians | 99.9 /100 | #58 | Exceptional 11.4% |
| Immigrants | Spain | 99.9 /100 | #59 | Exceptional 11.4% |
| Immigrants | Bulgaria | 99.9 /100 | #60 | Exceptional 11.4% |
| Immigrants | France | 99.9 /100 | #61 | Exceptional 11.4% |
| Sri Lankans | 99.9 /100 | #62 | Exceptional 11.4% |
| Immigrants | Colombia | 99.9 /100 | #63 | Exceptional 11.4% |
| Immigrants | El Salvador | 99.9 /100 | #64 | Exceptional 11.4% |
| Immigrants | South America | 99.9 /100 | #65 | Exceptional 11.4% |
| Salvadorans | 99.8 /100 | #66 | Exceptional 11.5% |
| Immigrants | Vietnam | 99.8 /100 | #67 | Exceptional 11.5% |