Haitian vs Immigrants from Spain Disability Age 5 to 17
COMPARE
Haitian
Immigrants from Spain
Disability Age 5 to 17
Disability Age 5 to 17 Comparison
Haitians
Immigrants from Spain
5.8%
DISABILITY AGE 5 TO 17
4.8/ 100
METRIC RATING
228th/ 347
METRIC RANK
5.2%
DISABILITY AGE 5 TO 17
99.4/ 100
METRIC RATING
89th/ 347
METRIC RANK
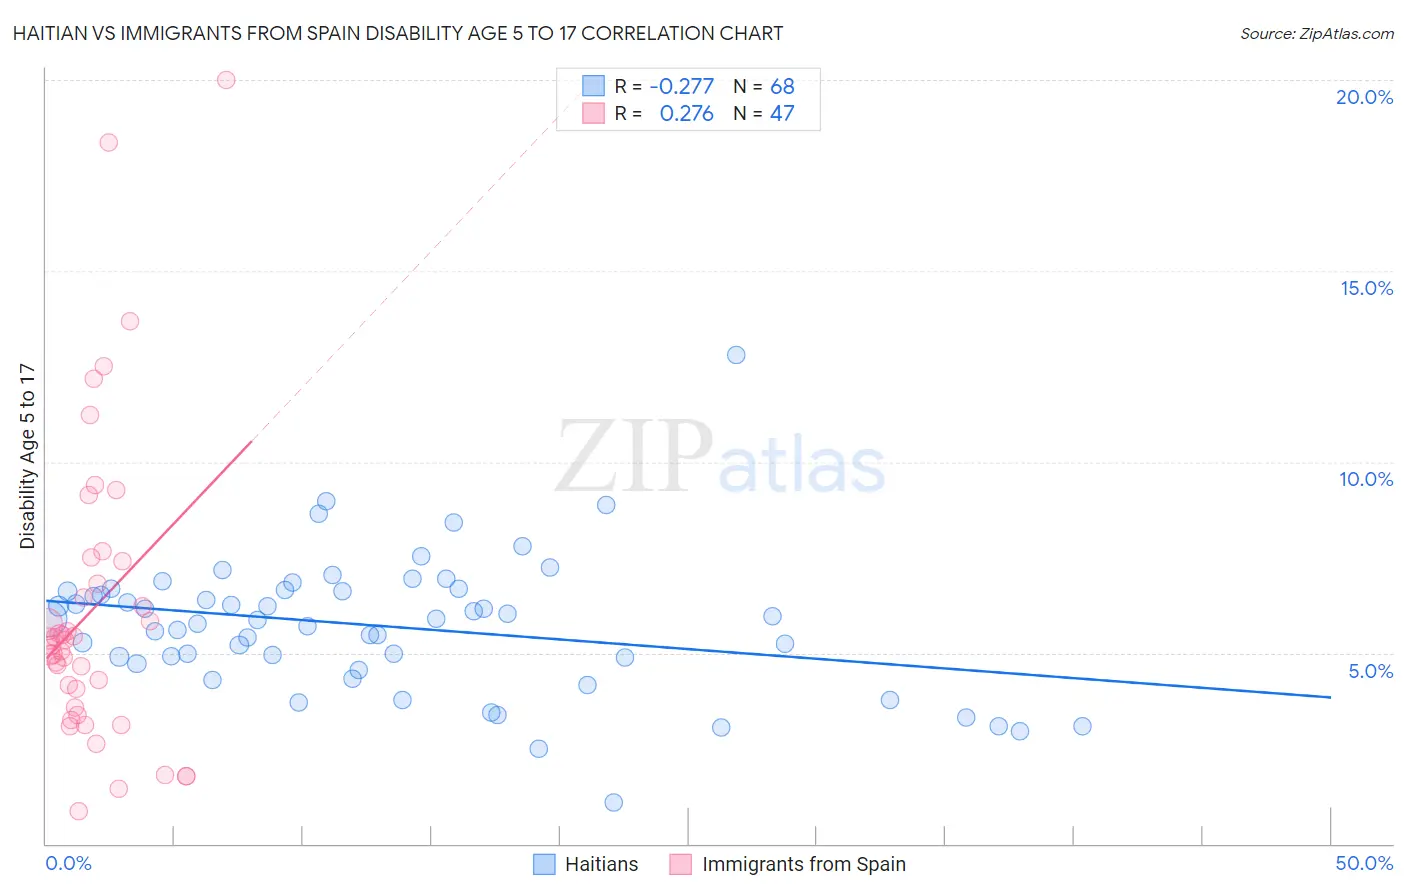
Haitian vs Immigrants from Spain Disability Age 5 to 17 Correlation Chart
The statistical analysis conducted on geographies consisting of 286,241,081 people shows a weak negative correlation between the proportion of Haitians and percentage of population with a disability between the ages 5 and 17 in the United States with a correlation coefficient (R) of -0.277 and weighted average of 5.8%. Similarly, the statistical analysis conducted on geographies consisting of 238,485,416 people shows a weak positive correlation between the proportion of Immigrants from Spain and percentage of population with a disability between the ages 5 and 17 in the United States with a correlation coefficient (R) of 0.276 and weighted average of 5.2%, a difference of 10.6%.
Disability Age 5 to 17 Correlation Summary
| Measurement | Haitian | Immigrants from Spain |
| Minimum | 1.1% | 0.84% |
| Maximum | 12.8% | 20.0% |
| Range | 11.7% | 19.2% |
| Mean | 5.7% | 6.1% |
| Median | 5.9% | 5.3% |
| Interquartile 25% (IQ1) | 4.8% | 3.6% |
| Interquartile 75% (IQ3) | 6.6% | 7.4% |
| Interquartile Range (IQR) | 1.8% | 3.9% |
| Standard Deviation (Sample) | 1.8% | 4.0% |
| Standard Deviation (Population) | 1.8% | 4.0% |
Similar Demographics by Disability Age 5 to 17
Demographics Similar to Haitians by Disability Age 5 to 17
In terms of disability age 5 to 17, the demographic groups most similar to Haitians are Bangladeshi (5.8%, a difference of 0.010%), Ghanaian (5.8%, a difference of 0.020%), Swiss (5.8%, a difference of 0.080%), European (5.8%, a difference of 0.090%), and British West Indian (5.8%, a difference of 0.16%).
| Demographics | Rating | Rank | Disability Age 5 to 17 |
| Lithuanians | 6.7 /100 | #221 | Tragic 5.8% |
| Immigrants | Sudan | 6.7 /100 | #222 | Tragic 5.8% |
| Alsatians | 6.0 /100 | #223 | Tragic 5.8% |
| Mexicans | 5.7 /100 | #224 | Tragic 5.8% |
| Guamanians/Chamorros | 5.6 /100 | #225 | Tragic 5.8% |
| British West Indians | 5.4 /100 | #226 | Tragic 5.8% |
| Swiss | 5.1 /100 | #227 | Tragic 5.8% |
| Haitians | 4.8 /100 | #228 | Tragic 5.8% |
| Bangladeshis | 4.8 /100 | #229 | Tragic 5.8% |
| Ghanaians | 4.7 /100 | #230 | Tragic 5.8% |
| Europeans | 4.5 /100 | #231 | Tragic 5.8% |
| Immigrants | Laos | 3.8 /100 | #232 | Tragic 5.8% |
| Immigrants | West Indies | 3.5 /100 | #233 | Tragic 5.8% |
| Immigrants | Kenya | 3.4 /100 | #234 | Tragic 5.8% |
| Malaysians | 3.4 /100 | #235 | Tragic 5.8% |
Demographics Similar to Immigrants from Spain by Disability Age 5 to 17
In terms of disability age 5 to 17, the demographic groups most similar to Immigrants from Spain are Immigrants from Croatia (5.2%, a difference of 0.0%), Eastern European (5.2%, a difference of 0.030%), Immigrants from Kuwait (5.3%, a difference of 0.050%), Immigrants from St. Vincent and the Grenadines (5.2%, a difference of 0.080%), and Bulgarian (5.2%, a difference of 0.12%).
| Demographics | Rating | Rank | Disability Age 5 to 17 |
| Immigrants | Sweden | 99.5 /100 | #82 | Exceptional 5.2% |
| Immigrants | France | 99.5 /100 | #83 | Exceptional 5.2% |
| Immigrants | Nicaragua | 99.5 /100 | #84 | Exceptional 5.2% |
| Bulgarians | 99.4 /100 | #85 | Exceptional 5.2% |
| Immigrants | St. Vincent and the Grenadines | 99.4 /100 | #86 | Exceptional 5.2% |
| Eastern Europeans | 99.4 /100 | #87 | Exceptional 5.2% |
| Immigrants | Croatia | 99.4 /100 | #88 | Exceptional 5.2% |
| Immigrants | Spain | 99.4 /100 | #89 | Exceptional 5.2% |
| Immigrants | Kuwait | 99.4 /100 | #90 | Exceptional 5.3% |
| Mongolians | 99.2 /100 | #91 | Exceptional 5.3% |
| Luxembourgers | 99.2 /100 | #92 | Exceptional 5.3% |
| Immigrants | Peru | 99.1 /100 | #93 | Exceptional 5.3% |
| Immigrants | Jordan | 99.1 /100 | #94 | Exceptional 5.3% |
| Immigrants | Grenada | 99.1 /100 | #95 | Exceptional 5.3% |
| Immigrants | El Salvador | 99.0 /100 | #96 | Exceptional 5.3% |