Polish vs Chilean Vision Disability
COMPARE
Polish
Chilean
Vision Disability
Vision Disability Comparison
Poles
Chileans
2.1%
VISION DISABILITY
92.0/ 100
METRIC RATING
117th/ 347
METRIC RANK
2.1%
VISION DISABILITY
94.0/ 100
METRIC RATING
109th/ 347
METRIC RANK
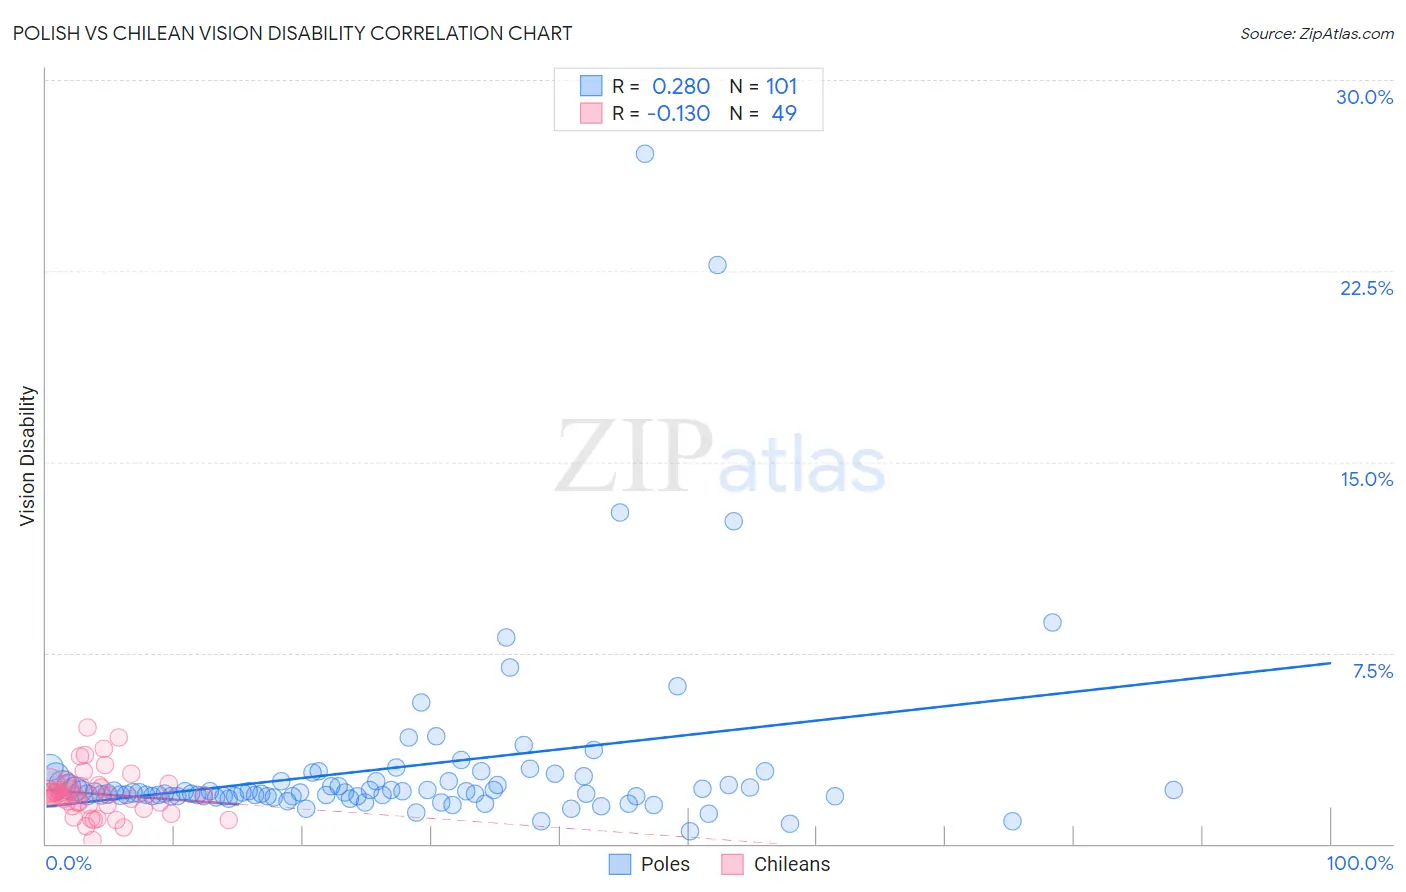
Polish vs Chilean Vision Disability Correlation Chart
The statistical analysis conducted on geographies consisting of 558,655,799 people shows a weak positive correlation between the proportion of Poles and percentage of population with vision disability in the United States with a correlation coefficient (R) of 0.280 and weighted average of 2.1%. Similarly, the statistical analysis conducted on geographies consisting of 256,590,640 people shows a poor negative correlation between the proportion of Chileans and percentage of population with vision disability in the United States with a correlation coefficient (R) of -0.130 and weighted average of 2.1%, a difference of 0.51%.
Vision Disability Correlation Summary
| Measurement | Polish | Chilean |
| Minimum | 0.47% | 0.17% |
| Maximum | 27.1% | 4.6% |
| Range | 26.7% | 4.4% |
| Mean | 3.0% | 2.0% |
| Median | 2.0% | 1.9% |
| Interquartile 25% (IQ1) | 1.9% | 1.5% |
| Interquartile 75% (IQ3) | 2.5% | 2.3% |
| Interquartile Range (IQR) | 0.60% | 0.79% |
| Standard Deviation (Sample) | 3.7% | 0.89% |
| Standard Deviation (Population) | 3.7% | 0.88% |
Demographics Similar to Poles and Chileans by Vision Disability
In terms of vision disability, the demographic groups most similar to Poles are Ugandan (2.1%, a difference of 0.040%), Immigrants from Vietnam (2.1%, a difference of 0.050%), Croatian (2.1%, a difference of 0.070%), Kenyan (2.1%, a difference of 0.11%), and Immigrants from Philippines (2.1%, a difference of 0.13%). Similarly, the demographic groups most similar to Chileans are Korean (2.1%, a difference of 0.020%), Swedish (2.1%, a difference of 0.050%), Danish (2.1%, a difference of 0.050%), Immigrants from Armenia (2.1%, a difference of 0.070%), and Carpatho Rusyn (2.1%, a difference of 0.10%).
| Demographics | Rating | Rank | Vision Disability |
| Immigrants | Austria | 94.4 /100 | #103 | Exceptional 2.1% |
| Immigrants | Italy | 94.4 /100 | #104 | Exceptional 2.1% |
| Carpatho Rusyns | 94.3 /100 | #105 | Exceptional 2.1% |
| Swedes | 94.2 /100 | #106 | Exceptional 2.1% |
| Danes | 94.2 /100 | #107 | Exceptional 2.1% |
| Koreans | 94.1 /100 | #108 | Exceptional 2.1% |
| Chileans | 94.0 /100 | #109 | Exceptional 2.1% |
| Immigrants | Armenia | 93.8 /100 | #110 | Exceptional 2.1% |
| Peruvians | 93.5 /100 | #111 | Exceptional 2.1% |
| Immigrants | Denmark | 92.9 /100 | #112 | Exceptional 2.1% |
| Kenyans | 92.5 /100 | #113 | Exceptional 2.1% |
| Croatians | 92.3 /100 | #114 | Exceptional 2.1% |
| Immigrants | Vietnam | 92.2 /100 | #115 | Exceptional 2.1% |
| Ugandans | 92.2 /100 | #116 | Exceptional 2.1% |
| Poles | 92.0 /100 | #117 | Exceptional 2.1% |
| Immigrants | Philippines | 91.4 /100 | #118 | Exceptional 2.1% |
| Immigrants | Uganda | 91.4 /100 | #119 | Exceptional 2.1% |
| Immigrants | Zimbabwe | 91.0 /100 | #120 | Exceptional 2.1% |
| Immigrants | Scotland | 90.4 /100 | #121 | Exceptional 2.1% |
| Immigrants | Ukraine | 90.4 /100 | #122 | Exceptional 2.1% |
| Immigrants | Albania | 90.4 /100 | #123 | Exceptional 2.1% |