Immigrants from Dominica vs Chilean Vision Disability
COMPARE
Immigrants from Dominica
Chilean
Vision Disability
Vision Disability Comparison
Immigrants from Dominica
Chileans
2.5%
VISION DISABILITY
0.0/ 100
METRIC RATING
297th/ 347
METRIC RANK
2.1%
VISION DISABILITY
94.0/ 100
METRIC RATING
109th/ 347
METRIC RANK
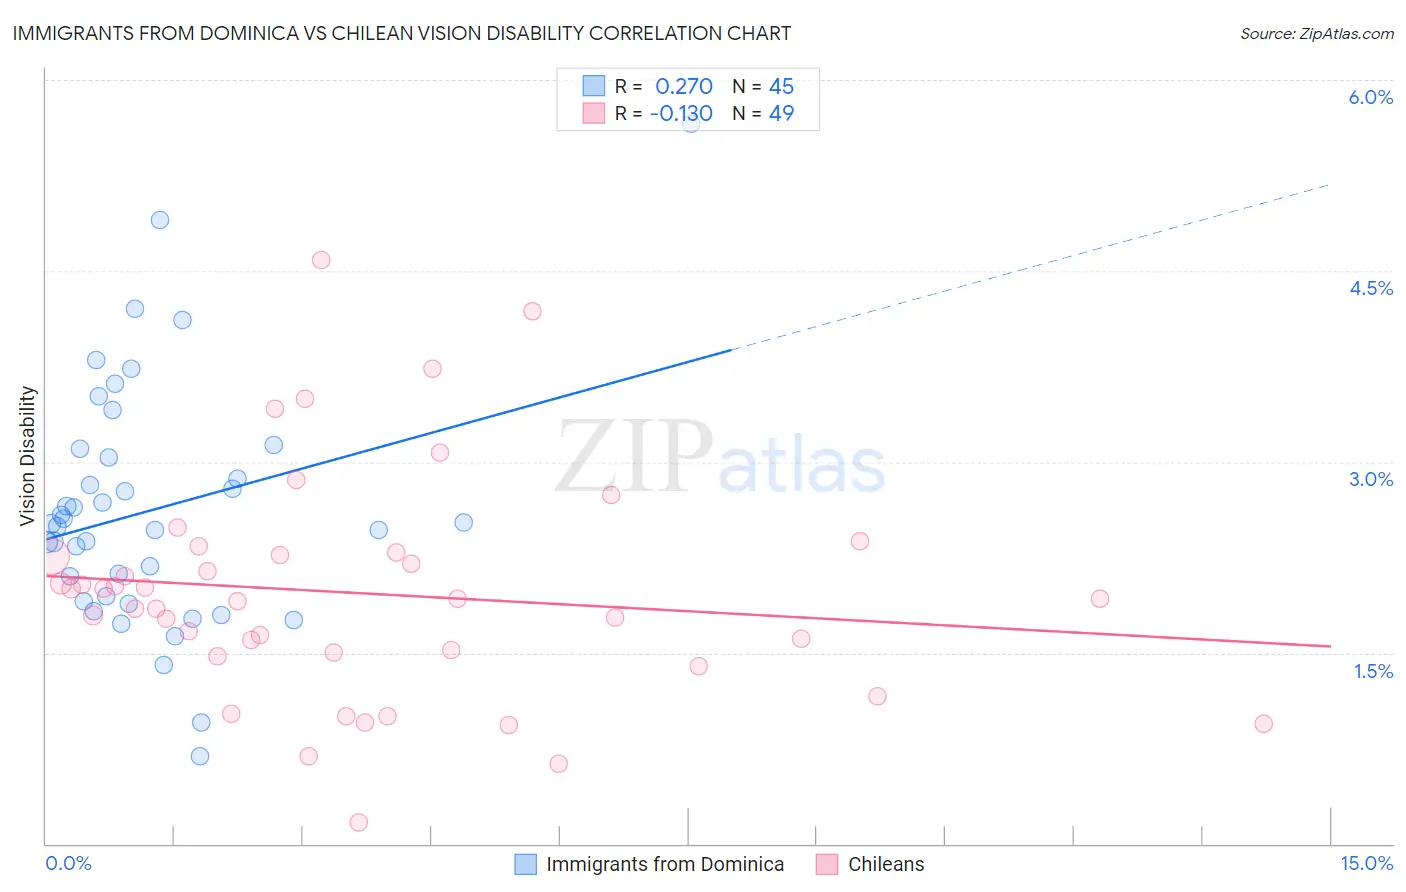
Immigrants from Dominica vs Chilean Vision Disability Correlation Chart
The statistical analysis conducted on geographies consisting of 83,777,112 people shows a weak positive correlation between the proportion of Immigrants from Dominica and percentage of population with vision disability in the United States with a correlation coefficient (R) of 0.270 and weighted average of 2.5%. Similarly, the statistical analysis conducted on geographies consisting of 256,590,640 people shows a poor negative correlation between the proportion of Chileans and percentage of population with vision disability in the United States with a correlation coefficient (R) of -0.130 and weighted average of 2.1%, a difference of 22.1%.
Vision Disability Correlation Summary
| Measurement | Immigrants from Dominica | Chilean |
| Minimum | 0.69% | 0.17% |
| Maximum | 5.7% | 4.6% |
| Range | 5.0% | 4.4% |
| Mean | 2.6% | 2.0% |
| Median | 2.5% | 1.9% |
| Interquartile 25% (IQ1) | 1.9% | 1.5% |
| Interquartile 75% (IQ3) | 3.1% | 2.3% |
| Interquartile Range (IQR) | 1.1% | 0.79% |
| Standard Deviation (Sample) | 0.95% | 0.89% |
| Standard Deviation (Population) | 0.94% | 0.88% |
Similar Demographics by Vision Disability
Demographics Similar to Immigrants from Dominica by Vision Disability
In terms of vision disability, the demographic groups most similar to Immigrants from Dominica are Mexican (2.5%, a difference of 0.14%), Cree (2.5%, a difference of 0.17%), African (2.5%, a difference of 0.37%), Menominee (2.5%, a difference of 0.55%), and Immigrants from Mexico (2.5%, a difference of 0.68%).
| Demographics | Rating | Rank | Vision Disability |
| Immigrants | Cuba | 0.0 /100 | #290 | Tragic 2.5% |
| Immigrants | Honduras | 0.0 /100 | #291 | Tragic 2.5% |
| Crow | 0.0 /100 | #292 | Tragic 2.5% |
| Yaqui | 0.0 /100 | #293 | Tragic 2.5% |
| Ottawa | 0.0 /100 | #294 | Tragic 2.5% |
| Delaware | 0.0 /100 | #295 | Tragic 2.5% |
| Immigrants | Mexico | 0.0 /100 | #296 | Tragic 2.5% |
| Immigrants | Dominica | 0.0 /100 | #297 | Tragic 2.5% |
| Mexicans | 0.0 /100 | #298 | Tragic 2.5% |
| Cree | 0.0 /100 | #299 | Tragic 2.5% |
| Africans | 0.0 /100 | #300 | Tragic 2.5% |
| Menominee | 0.0 /100 | #301 | Tragic 2.5% |
| Spanish American Indians | 0.0 /100 | #302 | Tragic 2.6% |
| Immigrants | Cabo Verde | 0.0 /100 | #303 | Tragic 2.6% |
| Aleuts | 0.0 /100 | #304 | Tragic 2.6% |
Demographics Similar to Chileans by Vision Disability
In terms of vision disability, the demographic groups most similar to Chileans are Korean (2.1%, a difference of 0.020%), Swedish (2.1%, a difference of 0.050%), Danish (2.1%, a difference of 0.050%), Immigrants from Armenia (2.1%, a difference of 0.070%), and Carpatho Rusyn (2.1%, a difference of 0.10%).
| Demographics | Rating | Rank | Vision Disability |
| Sri Lankans | 94.8 /100 | #102 | Exceptional 2.1% |
| Immigrants | Austria | 94.4 /100 | #103 | Exceptional 2.1% |
| Immigrants | Italy | 94.4 /100 | #104 | Exceptional 2.1% |
| Carpatho Rusyns | 94.3 /100 | #105 | Exceptional 2.1% |
| Swedes | 94.2 /100 | #106 | Exceptional 2.1% |
| Danes | 94.2 /100 | #107 | Exceptional 2.1% |
| Koreans | 94.1 /100 | #108 | Exceptional 2.1% |
| Chileans | 94.0 /100 | #109 | Exceptional 2.1% |
| Immigrants | Armenia | 93.8 /100 | #110 | Exceptional 2.1% |
| Peruvians | 93.5 /100 | #111 | Exceptional 2.1% |
| Immigrants | Denmark | 92.9 /100 | #112 | Exceptional 2.1% |
| Kenyans | 92.5 /100 | #113 | Exceptional 2.1% |
| Croatians | 92.3 /100 | #114 | Exceptional 2.1% |
| Immigrants | Vietnam | 92.2 /100 | #115 | Exceptional 2.1% |
| Ugandans | 92.2 /100 | #116 | Exceptional 2.1% |