Guyanese vs Pennsylvania German Vision Disability
COMPARE
Guyanese
Pennsylvania German
Vision Disability
Vision Disability Comparison
Guyanese
Pennsylvania Germans
2.2%
VISION DISABILITY
28.9/ 100
METRIC RATING
188th/ 347
METRIC RANK
2.2%
VISION DISABILITY
14.5/ 100
METRIC RATING
206th/ 347
METRIC RANK
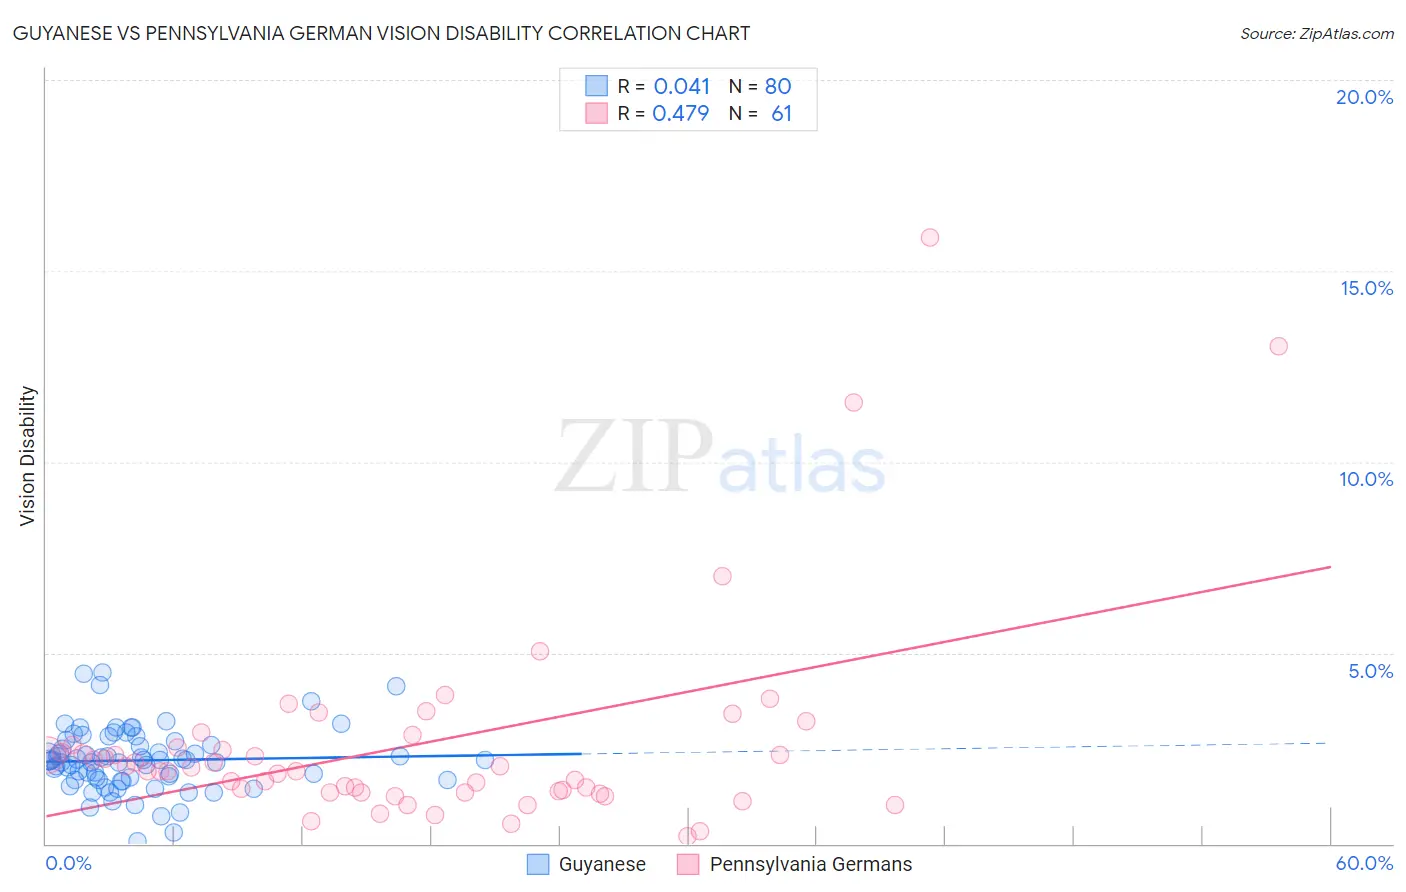
Guyanese vs Pennsylvania German Vision Disability Correlation Chart
The statistical analysis conducted on geographies consisting of 176,846,662 people shows no correlation between the proportion of Guyanese and percentage of population with vision disability in the United States with a correlation coefficient (R) of 0.041 and weighted average of 2.2%. Similarly, the statistical analysis conducted on geographies consisting of 233,923,332 people shows a moderate positive correlation between the proportion of Pennsylvania Germans and percentage of population with vision disability in the United States with a correlation coefficient (R) of 0.479 and weighted average of 2.2%, a difference of 1.3%.
Vision Disability Correlation Summary
| Measurement | Guyanese | Pennsylvania German |
| Minimum | 0.061% | 0.20% |
| Maximum | 4.5% | 15.9% |
| Range | 4.4% | 15.7% |
| Mean | 2.2% | 2.6% |
| Median | 2.2% | 1.9% |
| Interquartile 25% (IQ1) | 1.7% | 1.4% |
| Interquartile 75% (IQ3) | 2.6% | 2.6% |
| Interquartile Range (IQR) | 0.97% | 1.2% |
| Standard Deviation (Sample) | 0.83% | 2.8% |
| Standard Deviation (Population) | 0.82% | 2.7% |
Demographics Similar to Guyanese and Pennsylvania Germans by Vision Disability
In terms of vision disability, the demographic groups most similar to Guyanese are Immigrants from St. Vincent and the Grenadines (2.2%, a difference of 0.11%), Salvadoran (2.2%, a difference of 0.11%), Immigrants from Costa Rica (2.2%, a difference of 0.22%), Canadian (2.2%, a difference of 0.24%), and European (2.2%, a difference of 0.24%). Similarly, the demographic groups most similar to Pennsylvania Germans are Immigrants from Nigeria (2.2%, a difference of 0.13%), Samoan (2.2%, a difference of 0.14%), Immigrants from Guyana (2.2%, a difference of 0.17%), Dutch (2.2%, a difference of 0.30%), and Immigrants from Zaire (2.2%, a difference of 0.39%).
| Demographics | Rating | Rank | Vision Disability |
| Immigrants | St. Vincent and the Grenadines | 30.3 /100 | #187 | Fair 2.2% |
| Guyanese | 28.9 /100 | #188 | Fair 2.2% |
| Salvadorans | 27.4 /100 | #189 | Fair 2.2% |
| Immigrants | Costa Rica | 26.1 /100 | #190 | Fair 2.2% |
| Canadians | 25.8 /100 | #191 | Fair 2.2% |
| Europeans | 25.7 /100 | #192 | Fair 2.2% |
| British | 25.1 /100 | #193 | Fair 2.2% |
| Immigrants | Barbados | 24.0 /100 | #194 | Fair 2.2% |
| Immigrants | Immigrants | 23.7 /100 | #195 | Fair 2.2% |
| Immigrants | Grenada | 23.1 /100 | #196 | Fair 2.2% |
| Ghanaians | 21.8 /100 | #197 | Fair 2.2% |
| Czechoslovakians | 21.6 /100 | #198 | Fair 2.2% |
| Immigrants | El Salvador | 21.0 /100 | #199 | Fair 2.2% |
| Immigrants | Thailand | 20.1 /100 | #200 | Fair 2.2% |
| Slovaks | 18.8 /100 | #201 | Poor 2.2% |
| Immigrants | Zaire | 18.0 /100 | #202 | Poor 2.2% |
| Dutch | 17.1 /100 | #203 | Poor 2.2% |
| Immigrants | Guyana | 15.9 /100 | #204 | Poor 2.2% |
| Samoans | 15.7 /100 | #205 | Poor 2.2% |
| Pennsylvania Germans | 14.5 /100 | #206 | Poor 2.2% |
| Immigrants | Nigeria | 13.5 /100 | #207 | Poor 2.2% |