Guatemalan vs Immigrants from Sudan Male Disability
COMPARE
Guatemalan
Immigrants from Sudan
Male Disability
Male Disability Comparison
Guatemalans
Immigrants from Sudan
11.1%
MALE DISABILITY
67.2/ 100
METRIC RATING
159th/ 347
METRIC RANK
11.0%
MALE DISABILITY
81.5/ 100
METRIC RATING
142nd/ 347
METRIC RANK
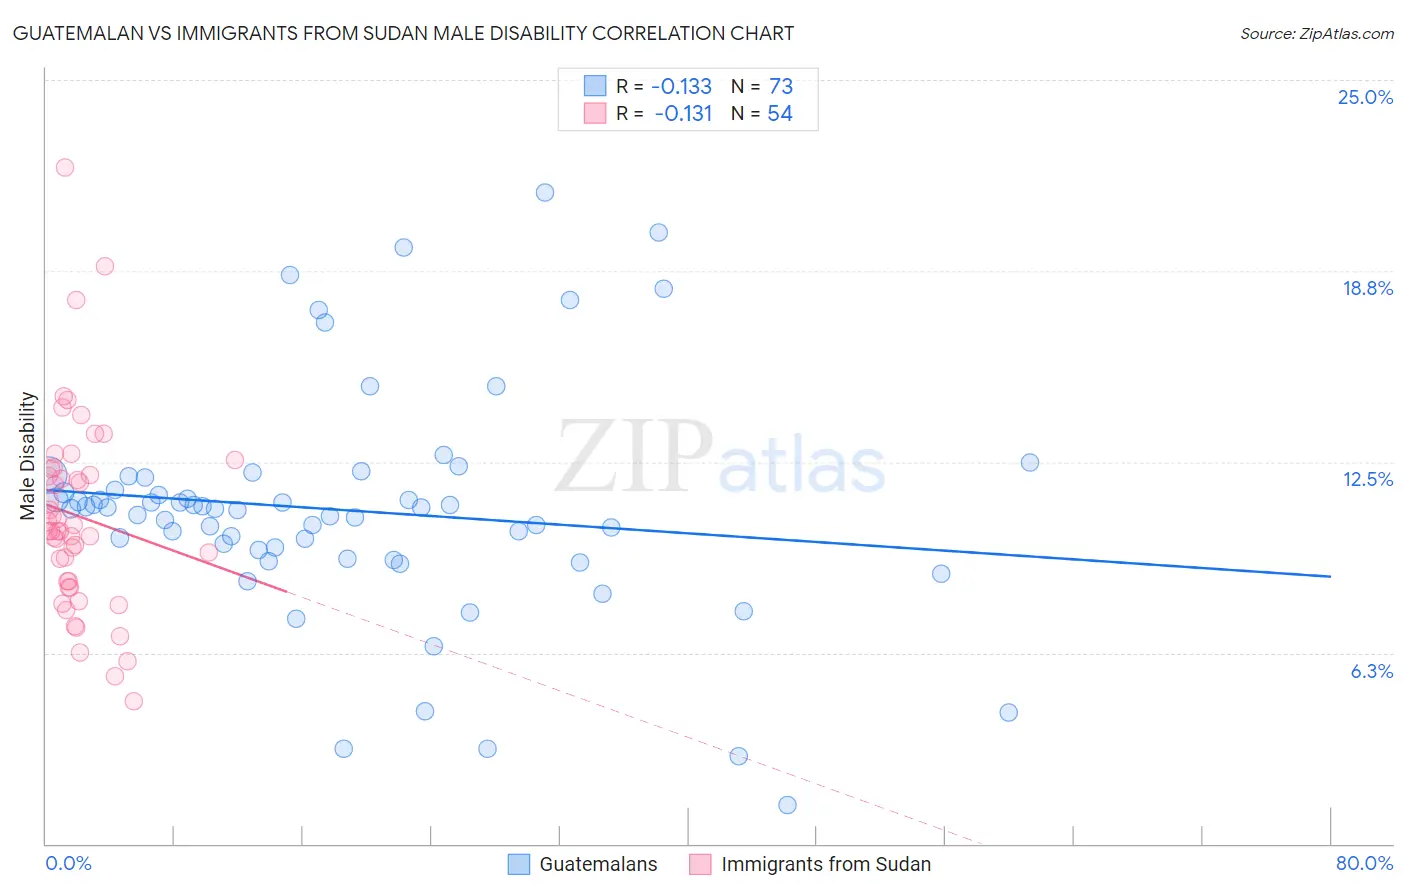
Guatemalan vs Immigrants from Sudan Male Disability Correlation Chart
The statistical analysis conducted on geographies consisting of 409,466,260 people shows a poor negative correlation between the proportion of Guatemalans and percentage of males with a disability in the United States with a correlation coefficient (R) of -0.133 and weighted average of 11.1%. Similarly, the statistical analysis conducted on geographies consisting of 118,961,882 people shows a poor negative correlation between the proportion of Immigrants from Sudan and percentage of males with a disability in the United States with a correlation coefficient (R) of -0.131 and weighted average of 11.0%, a difference of 1.1%.
Male Disability Correlation Summary
| Measurement | Guatemalan | Immigrants from Sudan |
| Minimum | 1.3% | 4.7% |
| Maximum | 21.3% | 22.1% |
| Range | 20.1% | 17.5% |
| Mean | 10.9% | 10.7% |
| Median | 11.0% | 10.2% |
| Interquartile 25% (IQ1) | 9.5% | 8.6% |
| Interquartile 75% (IQ3) | 11.8% | 12.3% |
| Interquartile Range (IQR) | 2.3% | 3.7% |
| Standard Deviation (Sample) | 3.8% | 3.2% |
| Standard Deviation (Population) | 3.7% | 3.2% |
Demographics Similar to Guatemalans and Immigrants from Sudan by Male Disability
In terms of male disability, the demographic groups most similar to Guatemalans are Albanian (11.1%, a difference of 0.040%), Latvian (11.1%, a difference of 0.060%), Immigrants from Western Africa (11.1%, a difference of 0.13%), Russian (11.1%, a difference of 0.17%), and Immigrants from Middle Africa (11.1%, a difference of 0.24%). Similarly, the demographic groups most similar to Immigrants from Sudan are Immigrants from Italy (11.0%, a difference of 0.0%), Arab (11.0%, a difference of 0.0%), Moroccan (11.0%, a difference of 0.070%), Kenyan (11.0%, a difference of 0.29%), and Costa Rican (11.0%, a difference of 0.30%).
| Demographics | Rating | Rank | Male Disability |
| Immigrants | Italy | 81.5 /100 | #140 | Excellent 11.0% |
| Arabs | 81.5 /100 | #141 | Excellent 11.0% |
| Immigrants | Sudan | 81.5 /100 | #142 | Excellent 11.0% |
| Moroccans | 80.7 /100 | #143 | Excellent 11.0% |
| Kenyans | 78.1 /100 | #144 | Good 11.0% |
| Costa Ricans | 78.0 /100 | #145 | Good 11.0% |
| Koreans | 77.5 /100 | #146 | Good 11.0% |
| Immigrants | Croatia | 77.3 /100 | #147 | Good 11.0% |
| Sudanese | 77.1 /100 | #148 | Good 11.0% |
| Immigrants | Denmark | 76.4 /100 | #149 | Good 11.0% |
| Immigrants | Guatemala | 75.1 /100 | #150 | Good 11.0% |
| Cubans | 74.9 /100 | #151 | Good 11.0% |
| Immigrants | Albania | 74.4 /100 | #152 | Good 11.0% |
| Immigrants | Northern Europe | 73.2 /100 | #153 | Good 11.1% |
| Immigrants | Moldova | 72.8 /100 | #154 | Good 11.1% |
| Immigrants | Middle Africa | 70.9 /100 | #155 | Good 11.1% |
| Russians | 69.8 /100 | #156 | Good 11.1% |
| Immigrants | Western Africa | 69.2 /100 | #157 | Good 11.1% |
| Latvians | 68.1 /100 | #158 | Good 11.1% |
| Guatemalans | 67.2 /100 | #159 | Good 11.1% |
| Albanians | 66.5 /100 | #160 | Good 11.1% |