Korean vs Immigrants from Sudan Male Disability
COMPARE
Korean
Immigrants from Sudan
Male Disability
Male Disability Comparison
Koreans
Immigrants from Sudan
11.0%
MALE DISABILITY
77.5/ 100
METRIC RATING
146th/ 347
METRIC RANK
11.0%
MALE DISABILITY
81.5/ 100
METRIC RATING
142nd/ 347
METRIC RANK
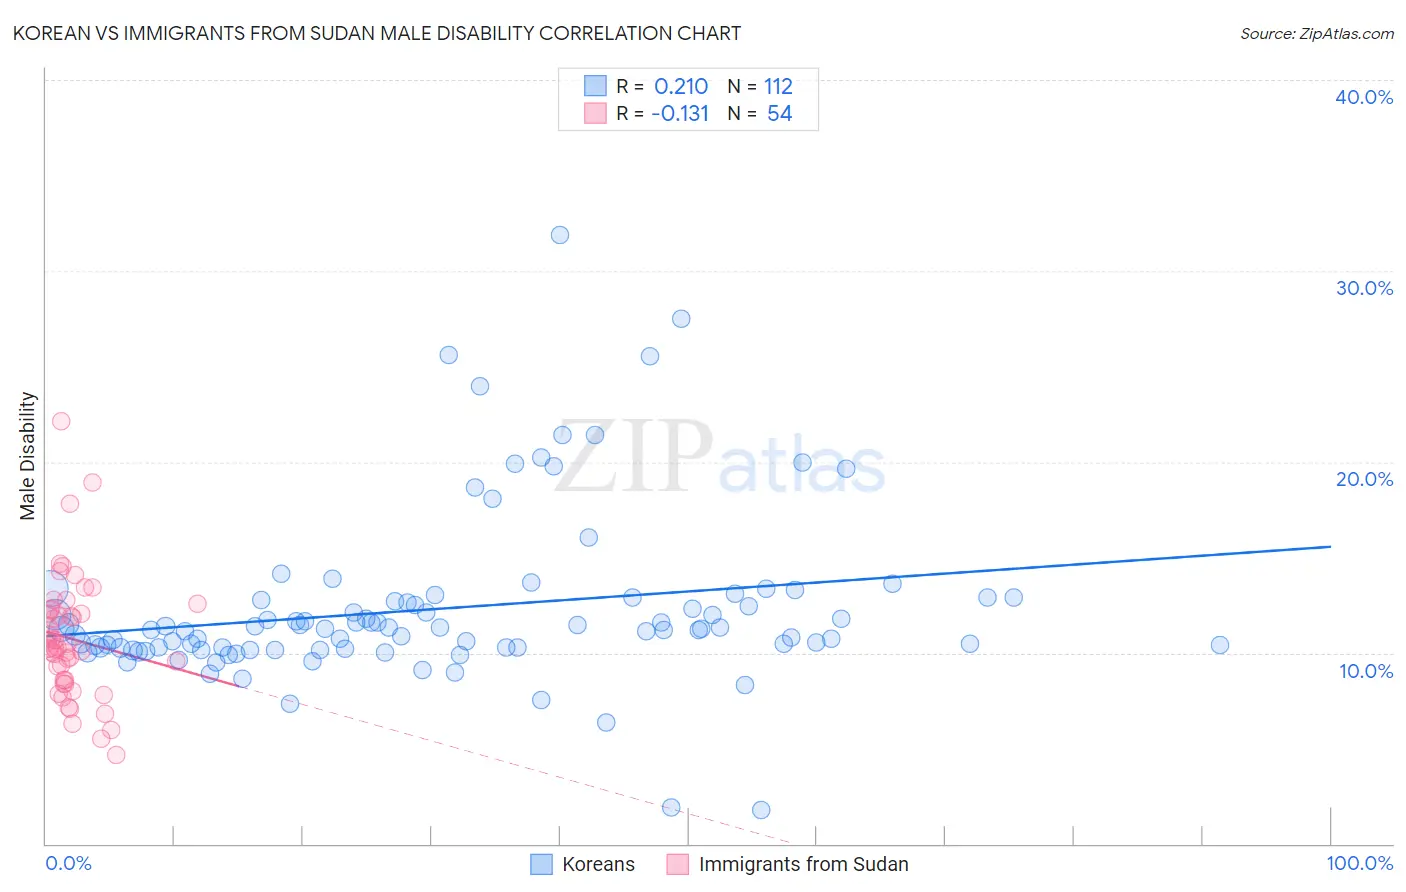
Korean vs Immigrants from Sudan Male Disability Correlation Chart
The statistical analysis conducted on geographies consisting of 510,777,181 people shows a weak positive correlation between the proportion of Koreans and percentage of males with a disability in the United States with a correlation coefficient (R) of 0.210 and weighted average of 11.0%. Similarly, the statistical analysis conducted on geographies consisting of 118,961,882 people shows a poor negative correlation between the proportion of Immigrants from Sudan and percentage of males with a disability in the United States with a correlation coefficient (R) of -0.131 and weighted average of 11.0%, a difference of 0.34%.
Male Disability Correlation Summary
| Measurement | Korean | Immigrants from Sudan |
| Minimum | 1.8% | 4.7% |
| Maximum | 31.9% | 22.1% |
| Range | 30.1% | 17.5% |
| Mean | 12.3% | 10.7% |
| Median | 11.3% | 10.2% |
| Interquartile 25% (IQ1) | 10.3% | 8.6% |
| Interquartile 75% (IQ3) | 12.8% | 12.3% |
| Interquartile Range (IQR) | 2.5% | 3.7% |
| Standard Deviation (Sample) | 4.5% | 3.2% |
| Standard Deviation (Population) | 4.5% | 3.2% |
Demographics Similar to Koreans and Immigrants from Sudan by Male Disability
In terms of male disability, the demographic groups most similar to Koreans are Immigrants from Croatia (11.0%, a difference of 0.020%), Sudanese (11.0%, a difference of 0.030%), Costa Rican (11.0%, a difference of 0.040%), Kenyan (11.0%, a difference of 0.050%), and Immigrants from Denmark (11.0%, a difference of 0.090%). Similarly, the demographic groups most similar to Immigrants from Sudan are Immigrants from Italy (11.0%, a difference of 0.0%), Arab (11.0%, a difference of 0.0%), South African (11.0%, a difference of 0.020%), Nigerian (11.0%, a difference of 0.040%), and Immigrants from Europe (11.0%, a difference of 0.050%).
| Demographics | Rating | Rank | Male Disability |
| Bhutanese | 83.4 /100 | #134 | Excellent 11.0% |
| Trinidadians and Tobagonians | 83.3 /100 | #135 | Excellent 11.0% |
| Immigrants | Costa Rica | 82.8 /100 | #136 | Excellent 11.0% |
| Immigrants | Europe | 82.0 /100 | #137 | Excellent 11.0% |
| Nigerians | 81.9 /100 | #138 | Excellent 11.0% |
| South Africans | 81.7 /100 | #139 | Excellent 11.0% |
| Immigrants | Italy | 81.5 /100 | #140 | Excellent 11.0% |
| Arabs | 81.5 /100 | #141 | Excellent 11.0% |
| Immigrants | Sudan | 81.5 /100 | #142 | Excellent 11.0% |
| Moroccans | 80.7 /100 | #143 | Excellent 11.0% |
| Kenyans | 78.1 /100 | #144 | Good 11.0% |
| Costa Ricans | 78.0 /100 | #145 | Good 11.0% |
| Koreans | 77.5 /100 | #146 | Good 11.0% |
| Immigrants | Croatia | 77.3 /100 | #147 | Good 11.0% |
| Sudanese | 77.1 /100 | #148 | Good 11.0% |
| Immigrants | Denmark | 76.4 /100 | #149 | Good 11.0% |
| Immigrants | Guatemala | 75.1 /100 | #150 | Good 11.0% |
| Cubans | 74.9 /100 | #151 | Good 11.0% |
| Immigrants | Albania | 74.4 /100 | #152 | Good 11.0% |
| Immigrants | Northern Europe | 73.2 /100 | #153 | Good 11.1% |
| Immigrants | Moldova | 72.8 /100 | #154 | Good 11.1% |