Polish vs Immigrants from Sudan Male Disability
COMPARE
Polish
Immigrants from Sudan
Male Disability
Male Disability Comparison
Poles
Immigrants from Sudan
12.0%
MALE DISABILITY
0.7/ 100
METRIC RATING
248th/ 347
METRIC RANK
11.0%
MALE DISABILITY
81.5/ 100
METRIC RATING
142nd/ 347
METRIC RANK
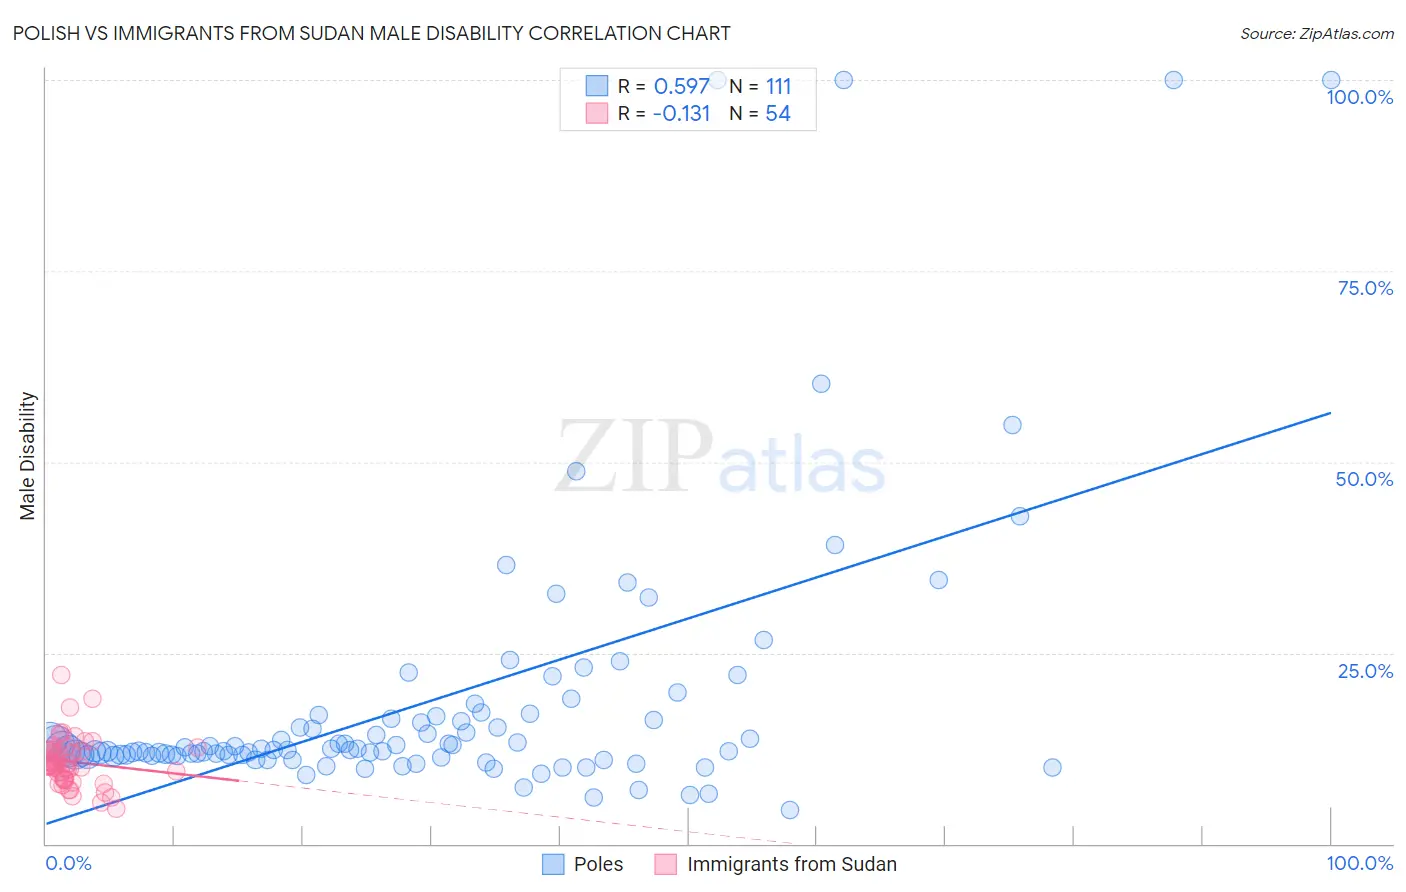
Polish vs Immigrants from Sudan Male Disability Correlation Chart
The statistical analysis conducted on geographies consisting of 560,313,997 people shows a substantial positive correlation between the proportion of Poles and percentage of males with a disability in the United States with a correlation coefficient (R) of 0.597 and weighted average of 12.0%. Similarly, the statistical analysis conducted on geographies consisting of 118,961,882 people shows a poor negative correlation between the proportion of Immigrants from Sudan and percentage of males with a disability in the United States with a correlation coefficient (R) of -0.131 and weighted average of 11.0%, a difference of 9.0%.
Male Disability Correlation Summary
| Measurement | Polish | Immigrants from Sudan |
| Minimum | 4.3% | 4.7% |
| Maximum | 100.0% | 22.1% |
| Range | 95.7% | 17.5% |
| Mean | 18.7% | 10.7% |
| Median | 12.3% | 10.2% |
| Interquartile 25% (IQ1) | 11.5% | 8.6% |
| Interquartile 75% (IQ3) | 16.7% | 12.3% |
| Interquartile Range (IQR) | 5.2% | 3.7% |
| Standard Deviation (Sample) | 18.4% | 3.2% |
| Standard Deviation (Population) | 18.3% | 3.2% |
Similar Demographics by Male Disability
Demographics Similar to Poles by Male Disability
In terms of male disability, the demographic groups most similar to Poles are Hungarian (12.0%, a difference of 0.18%), Danish (11.9%, a difference of 0.36%), Immigrants from Yemen (12.0%, a difference of 0.36%), Immigrants from Laos (11.9%, a difference of 0.40%), and Immigrants from Liberia (11.9%, a difference of 0.40%).
| Demographics | Rating | Rank | Male Disability |
| Bahamians | 1.1 /100 | #241 | Tragic 11.9% |
| Northern Europeans | 1.1 /100 | #242 | Tragic 11.9% |
| Samoans | 1.1 /100 | #243 | Tragic 11.9% |
| Immigrants | Laos | 1.0 /100 | #244 | Tragic 11.9% |
| Immigrants | Liberia | 1.0 /100 | #245 | Tragic 11.9% |
| Danes | 0.9 /100 | #246 | Tragic 11.9% |
| Hungarians | 0.8 /100 | #247 | Tragic 12.0% |
| Poles | 0.7 /100 | #248 | Tragic 12.0% |
| Immigrants | Yemen | 0.5 /100 | #249 | Tragic 12.0% |
| Bangladeshis | 0.5 /100 | #250 | Tragic 12.0% |
| German Russians | 0.5 /100 | #251 | Tragic 12.0% |
| Slovenes | 0.5 /100 | #252 | Tragic 12.0% |
| Guamanians/Chamorros | 0.5 /100 | #253 | Tragic 12.0% |
| British | 0.4 /100 | #254 | Tragic 12.1% |
| Chinese | 0.4 /100 | #255 | Tragic 12.1% |
Demographics Similar to Immigrants from Sudan by Male Disability
In terms of male disability, the demographic groups most similar to Immigrants from Sudan are Immigrants from Italy (11.0%, a difference of 0.0%), Arab (11.0%, a difference of 0.0%), South African (11.0%, a difference of 0.020%), Nigerian (11.0%, a difference of 0.040%), and Immigrants from Europe (11.0%, a difference of 0.050%).
| Demographics | Rating | Rank | Male Disability |
| Trinidadians and Tobagonians | 83.3 /100 | #135 | Excellent 11.0% |
| Immigrants | Costa Rica | 82.8 /100 | #136 | Excellent 11.0% |
| Immigrants | Europe | 82.0 /100 | #137 | Excellent 11.0% |
| Nigerians | 81.9 /100 | #138 | Excellent 11.0% |
| South Africans | 81.7 /100 | #139 | Excellent 11.0% |
| Immigrants | Italy | 81.5 /100 | #140 | Excellent 11.0% |
| Arabs | 81.5 /100 | #141 | Excellent 11.0% |
| Immigrants | Sudan | 81.5 /100 | #142 | Excellent 11.0% |
| Moroccans | 80.7 /100 | #143 | Excellent 11.0% |
| Kenyans | 78.1 /100 | #144 | Good 11.0% |
| Costa Ricans | 78.0 /100 | #145 | Good 11.0% |
| Koreans | 77.5 /100 | #146 | Good 11.0% |
| Immigrants | Croatia | 77.3 /100 | #147 | Good 11.0% |
| Sudanese | 77.1 /100 | #148 | Good 11.0% |
| Immigrants | Denmark | 76.4 /100 | #149 | Good 11.0% |