Guatemalan vs Immigrants from Sudan Unemployment Among Ages 16 to 19 years
COMPARE
Guatemalan
Immigrants from Sudan
Unemployment Among Ages 16 to 19 years
Unemployment Among Ages 16 to 19 years Comparison
Guatemalans
Immigrants from Sudan
18.6%
UNEMPLOYMENT AMONG AGES 16 TO 19 YEARS
0.8/ 100
METRIC RATING
244th/ 347
METRIC RANK
16.0%
UNEMPLOYMENT AMONG AGES 16 TO 19 YEARS
99.9/ 100
METRIC RATING
27th/ 347
METRIC RANK
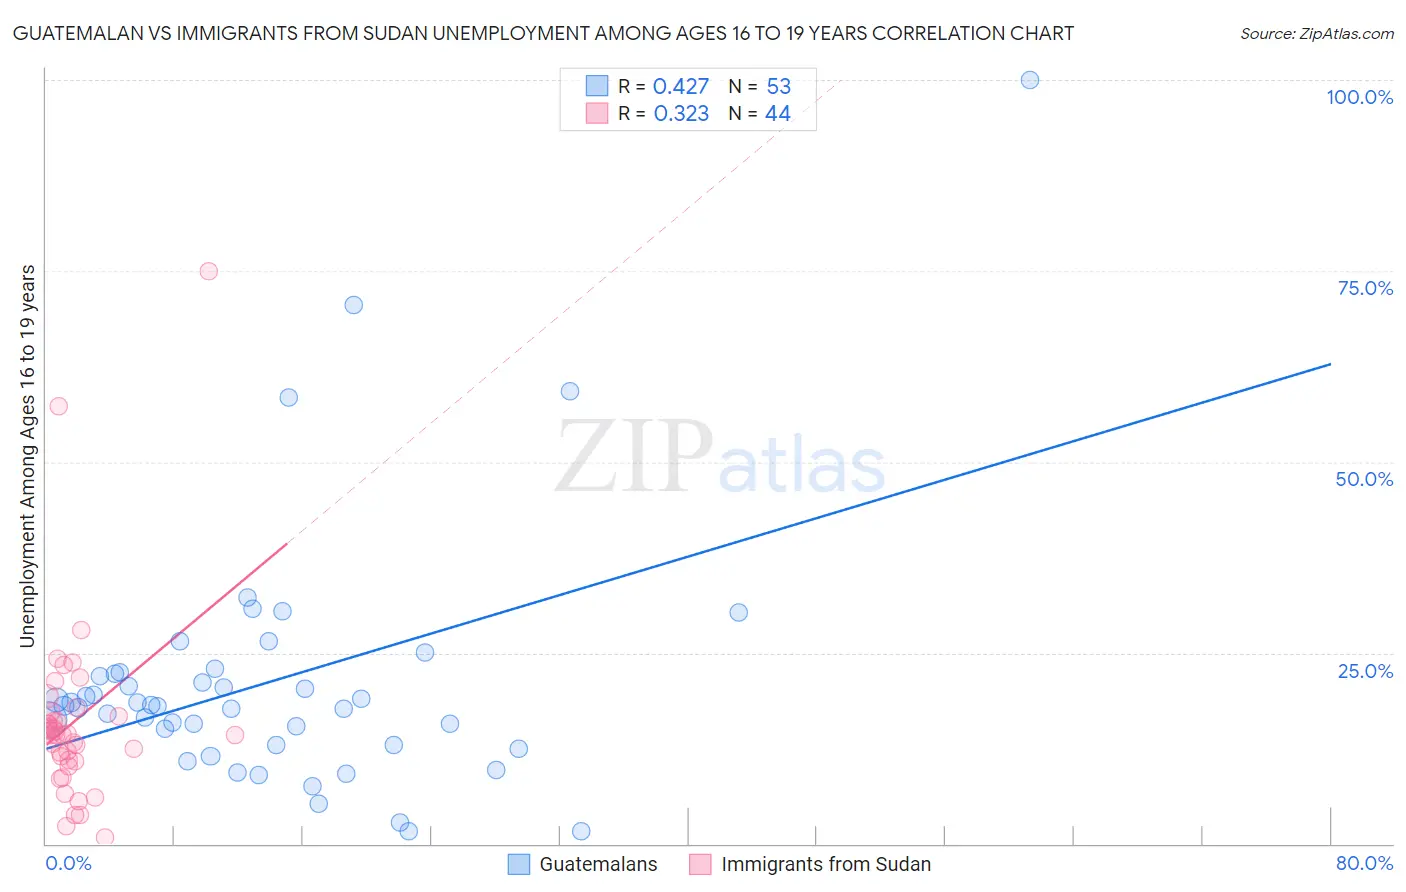
Guatemalan vs Immigrants from Sudan Unemployment Among Ages 16 to 19 years Correlation Chart
The statistical analysis conducted on geographies consisting of 390,544,351 people shows a moderate positive correlation between the proportion of Guatemalans and unemployment rate among population between the ages 16 and 19 in the United States with a correlation coefficient (R) of 0.427 and weighted average of 18.6%. Similarly, the statistical analysis conducted on geographies consisting of 117,284,224 people shows a mild positive correlation between the proportion of Immigrants from Sudan and unemployment rate among population between the ages 16 and 19 in the United States with a correlation coefficient (R) of 0.323 and weighted average of 16.0%, a difference of 16.1%.
Unemployment Among Ages 16 to 19 years Correlation Summary
| Measurement | Guatemalan | Immigrants from Sudan |
| Minimum | 1.7% | 0.90% |
| Maximum | 100.0% | 75.0% |
| Range | 98.3% | 74.1% |
| Mean | 21.3% | 16.0% |
| Median | 18.1% | 14.3% |
| Interquartile 25% (IQ1) | 12.9% | 10.9% |
| Interquartile 75% (IQ3) | 22.4% | 17.0% |
| Interquartile Range (IQR) | 9.4% | 6.1% |
| Standard Deviation (Sample) | 16.9% | 12.7% |
| Standard Deviation (Population) | 16.7% | 12.5% |
Similar Demographics by Unemployment Among Ages 16 to 19 years
Demographics Similar to Guatemalans by Unemployment Among Ages 16 to 19 years
In terms of unemployment among ages 16 to 19 years, the demographic groups most similar to Guatemalans are Immigrants from Belarus (18.6%, a difference of 0.010%), Mexican (18.5%, a difference of 0.21%), Moroccan (18.5%, a difference of 0.37%), Immigrants from South America (18.7%, a difference of 0.43%), and Immigrants from Israel (18.7%, a difference of 0.48%).
| Demographics | Rating | Rank | Unemployment Among Ages 16 to 19 years |
| Immigrants | Immigrants | 2.7 /100 | #237 | Tragic 18.3% |
| South Americans | 2.6 /100 | #238 | Tragic 18.3% |
| Native Hawaiians | 2.4 /100 | #239 | Tragic 18.3% |
| Immigrants | Cabo Verde | 2.0 /100 | #240 | Tragic 18.4% |
| Immigrants | Ukraine | 1.3 /100 | #241 | Tragic 18.5% |
| Moroccans | 1.1 /100 | #242 | Tragic 18.5% |
| Mexicans | 0.9 /100 | #243 | Tragic 18.5% |
| Guatemalans | 0.8 /100 | #244 | Tragic 18.6% |
| Immigrants | Belarus | 0.8 /100 | #245 | Tragic 18.6% |
| Immigrants | South America | 0.5 /100 | #246 | Tragic 18.7% |
| Immigrants | Israel | 0.5 /100 | #247 | Tragic 18.7% |
| Delaware | 0.5 /100 | #248 | Tragic 18.7% |
| Puget Sound Salish | 0.5 /100 | #249 | Tragic 18.7% |
| Panamanians | 0.4 /100 | #250 | Tragic 18.7% |
| Sub-Saharan Africans | 0.4 /100 | #251 | Tragic 18.7% |
Demographics Similar to Immigrants from Sudan by Unemployment Among Ages 16 to 19 years
In terms of unemployment among ages 16 to 19 years, the demographic groups most similar to Immigrants from Sudan are Jordanian (16.0%, a difference of 0.18%), Chinese (16.0%, a difference of 0.23%), Kenyan (16.1%, a difference of 0.27%), English (16.1%, a difference of 0.32%), and Dutch (15.9%, a difference of 0.47%).
| Demographics | Rating | Rank | Unemployment Among Ages 16 to 19 years |
| Sudanese | 100.0 /100 | #20 | Exceptional 15.8% |
| Immigrants | Taiwan | 100.0 /100 | #21 | Exceptional 15.8% |
| Finns | 100.0 /100 | #22 | Exceptional 15.9% |
| Belgians | 100.0 /100 | #23 | Exceptional 15.9% |
| Tongans | 100.0 /100 | #24 | Exceptional 15.9% |
| Filipinos | 100.0 /100 | #25 | Exceptional 15.9% |
| Dutch | 100.0 /100 | #26 | Exceptional 15.9% |
| Immigrants | Sudan | 99.9 /100 | #27 | Exceptional 16.0% |
| Jordanians | 99.9 /100 | #28 | Exceptional 16.0% |
| Chinese | 99.9 /100 | #29 | Exceptional 16.0% |
| Kenyans | 99.9 /100 | #30 | Exceptional 16.1% |
| English | 99.9 /100 | #31 | Exceptional 16.1% |
| Europeans | 99.9 /100 | #32 | Exceptional 16.1% |
| Immigrants | Kenya | 99.9 /100 | #33 | Exceptional 16.2% |
| Pennsylvania Germans | 99.9 /100 | #34 | Exceptional 16.2% |