Iroquois vs Immigrants from Sudan Male Disability
COMPARE
Iroquois
Immigrants from Sudan
Male Disability
Male Disability Comparison
Iroquois
Immigrants from Sudan
13.6%
MALE DISABILITY
0.0/ 100
METRIC RATING
315th/ 347
METRIC RANK
11.0%
MALE DISABILITY
81.5/ 100
METRIC RATING
142nd/ 347
METRIC RANK
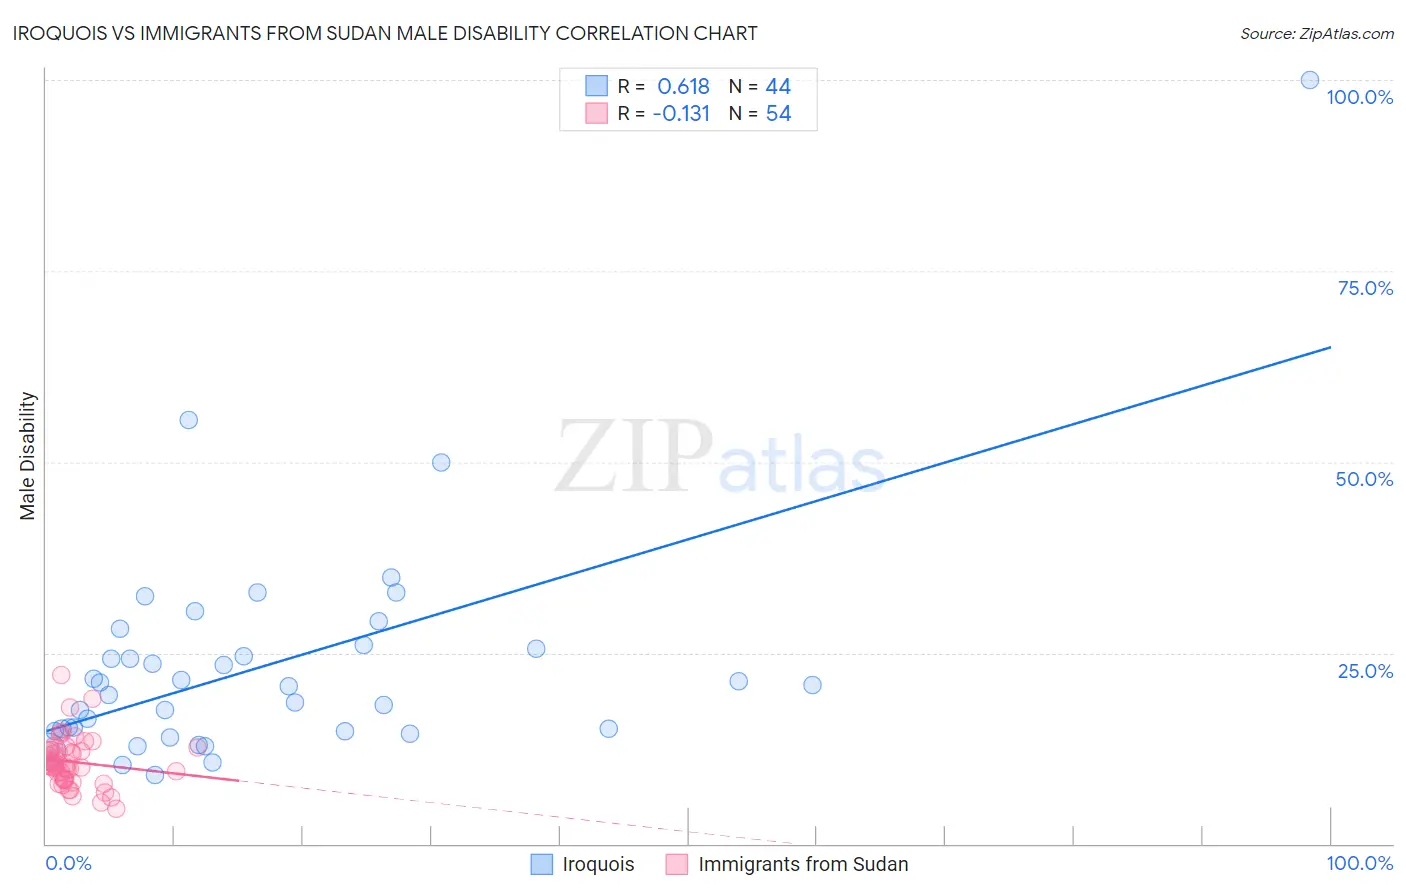
Iroquois vs Immigrants from Sudan Male Disability Correlation Chart
The statistical analysis conducted on geographies consisting of 207,273,711 people shows a significant positive correlation between the proportion of Iroquois and percentage of males with a disability in the United States with a correlation coefficient (R) of 0.618 and weighted average of 13.6%. Similarly, the statistical analysis conducted on geographies consisting of 118,961,882 people shows a poor negative correlation between the proportion of Immigrants from Sudan and percentage of males with a disability in the United States with a correlation coefficient (R) of -0.131 and weighted average of 11.0%, a difference of 23.5%.
Male Disability Correlation Summary
| Measurement | Iroquois | Immigrants from Sudan |
| Minimum | 9.0% | 4.7% |
| Maximum | 100.0% | 22.1% |
| Range | 91.0% | 17.5% |
| Mean | 23.4% | 10.7% |
| Median | 20.7% | 10.2% |
| Interquartile 25% (IQ1) | 14.9% | 8.6% |
| Interquartile 75% (IQ3) | 25.8% | 12.3% |
| Interquartile Range (IQR) | 11.0% | 3.7% |
| Standard Deviation (Sample) | 15.2% | 3.2% |
| Standard Deviation (Population) | 15.0% | 3.2% |
Similar Demographics by Male Disability
Demographics Similar to Iroquois by Male Disability
In terms of male disability, the demographic groups most similar to Iroquois are Alaska Native (13.6%, a difference of 0.050%), Aleut (13.5%, a difference of 0.16%), Puget Sound Salish (13.5%, a difference of 0.22%), Yakama (13.5%, a difference of 0.24%), and Delaware (13.5%, a difference of 0.79%).
| Demographics | Rating | Rank | Male Disability |
| French American Indians | 0.0 /100 | #308 | Tragic 13.4% |
| Blackfeet | 0.0 /100 | #309 | Tragic 13.4% |
| Immigrants | Azores | 0.0 /100 | #310 | Tragic 13.4% |
| Delaware | 0.0 /100 | #311 | Tragic 13.5% |
| Yakama | 0.0 /100 | #312 | Tragic 13.5% |
| Puget Sound Salish | 0.0 /100 | #313 | Tragic 13.5% |
| Aleuts | 0.0 /100 | #314 | Tragic 13.5% |
| Iroquois | 0.0 /100 | #315 | Tragic 13.6% |
| Alaska Natives | 0.0 /100 | #316 | Tragic 13.6% |
| Paiute | 0.0 /100 | #317 | Tragic 13.7% |
| Cree | 0.0 /100 | #318 | Tragic 13.7% |
| Americans | 0.0 /100 | #319 | Tragic 13.8% |
| Tlingit-Haida | 0.0 /100 | #320 | Tragic 13.8% |
| Shoshone | 0.0 /100 | #321 | Tragic 13.8% |
| Apache | 0.0 /100 | #322 | Tragic 14.0% |
Demographics Similar to Immigrants from Sudan by Male Disability
In terms of male disability, the demographic groups most similar to Immigrants from Sudan are Immigrants from Italy (11.0%, a difference of 0.0%), Arab (11.0%, a difference of 0.0%), South African (11.0%, a difference of 0.020%), Nigerian (11.0%, a difference of 0.040%), and Immigrants from Europe (11.0%, a difference of 0.050%).
| Demographics | Rating | Rank | Male Disability |
| Trinidadians and Tobagonians | 83.3 /100 | #135 | Excellent 11.0% |
| Immigrants | Costa Rica | 82.8 /100 | #136 | Excellent 11.0% |
| Immigrants | Europe | 82.0 /100 | #137 | Excellent 11.0% |
| Nigerians | 81.9 /100 | #138 | Excellent 11.0% |
| South Africans | 81.7 /100 | #139 | Excellent 11.0% |
| Immigrants | Italy | 81.5 /100 | #140 | Excellent 11.0% |
| Arabs | 81.5 /100 | #141 | Excellent 11.0% |
| Immigrants | Sudan | 81.5 /100 | #142 | Excellent 11.0% |
| Moroccans | 80.7 /100 | #143 | Excellent 11.0% |
| Kenyans | 78.1 /100 | #144 | Good 11.0% |
| Costa Ricans | 78.0 /100 | #145 | Good 11.0% |
| Koreans | 77.5 /100 | #146 | Good 11.0% |
| Immigrants | Croatia | 77.3 /100 | #147 | Good 11.0% |
| Sudanese | 77.1 /100 | #148 | Good 11.0% |
| Immigrants | Denmark | 76.4 /100 | #149 | Good 11.0% |