Guatemalan vs Immigrants from Oceania Male Disability
COMPARE
Guatemalan
Immigrants from Oceania
Male Disability
Male Disability Comparison
Guatemalans
Immigrants from Oceania
11.1%
MALE DISABILITY
67.2/ 100
METRIC RATING
159th/ 347
METRIC RANK
11.4%
MALE DISABILITY
20.9/ 100
METRIC RATING
195th/ 347
METRIC RANK
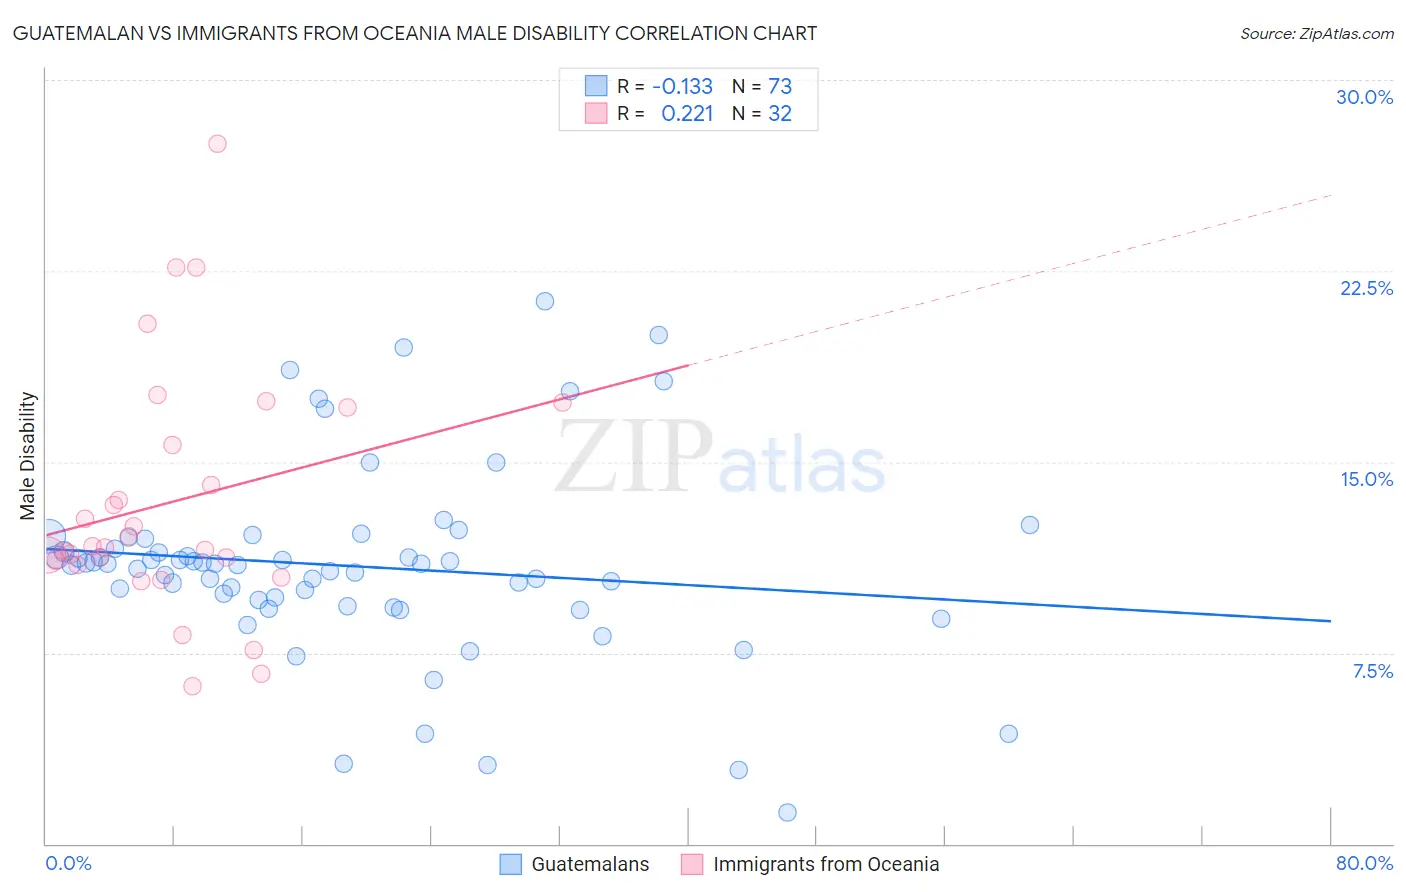
Guatemalan vs Immigrants from Oceania Male Disability Correlation Chart
The statistical analysis conducted on geographies consisting of 409,466,260 people shows a poor negative correlation between the proportion of Guatemalans and percentage of males with a disability in the United States with a correlation coefficient (R) of -0.133 and weighted average of 11.1%. Similarly, the statistical analysis conducted on geographies consisting of 305,477,901 people shows a weak positive correlation between the proportion of Immigrants from Oceania and percentage of males with a disability in the United States with a correlation coefficient (R) of 0.221 and weighted average of 11.4%, a difference of 2.9%.
Male Disability Correlation Summary
| Measurement | Guatemalan | Immigrants from Oceania |
| Minimum | 1.3% | 6.2% |
| Maximum | 21.3% | 27.5% |
| Range | 20.1% | 21.3% |
| Mean | 10.9% | 13.4% |
| Median | 11.0% | 11.7% |
| Interquartile 25% (IQ1) | 9.5% | 11.0% |
| Interquartile 75% (IQ3) | 11.8% | 16.4% |
| Interquartile Range (IQR) | 2.3% | 5.4% |
| Standard Deviation (Sample) | 3.8% | 4.8% |
| Standard Deviation (Population) | 3.7% | 4.7% |
Similar Demographics by Male Disability
Demographics Similar to Guatemalans by Male Disability
In terms of male disability, the demographic groups most similar to Guatemalans are Albanian (11.1%, a difference of 0.040%), Latvian (11.1%, a difference of 0.060%), Immigrants from West Indies (11.1%, a difference of 0.090%), Immigrants from Haiti (11.1%, a difference of 0.12%), and Immigrants from Western Africa (11.1%, a difference of 0.13%).
| Demographics | Rating | Rank | Male Disability |
| Immigrants | Albania | 74.4 /100 | #152 | Good 11.0% |
| Immigrants | Northern Europe | 73.2 /100 | #153 | Good 11.1% |
| Immigrants | Moldova | 72.8 /100 | #154 | Good 11.1% |
| Immigrants | Middle Africa | 70.9 /100 | #155 | Good 11.1% |
| Russians | 69.8 /100 | #156 | Good 11.1% |
| Immigrants | Western Africa | 69.2 /100 | #157 | Good 11.1% |
| Latvians | 68.1 /100 | #158 | Good 11.1% |
| Guatemalans | 67.2 /100 | #159 | Good 11.1% |
| Albanians | 66.5 /100 | #160 | Good 11.1% |
| Immigrants | West Indies | 65.7 /100 | #161 | Good 11.1% |
| Immigrants | Haiti | 65.3 /100 | #162 | Good 11.1% |
| Immigrants | Kenya | 63.8 /100 | #163 | Good 11.1% |
| British West Indians | 62.8 /100 | #164 | Good 11.1% |
| Luxembourgers | 61.9 /100 | #165 | Good 11.1% |
| Immigrants | Hungary | 61.2 /100 | #166 | Good 11.1% |
Demographics Similar to Immigrants from Oceania by Male Disability
In terms of male disability, the demographic groups most similar to Immigrants from Oceania are Belizean (11.4%, a difference of 0.030%), Greek (11.4%, a difference of 0.11%), Assyrian/Chaldean/Syriac (11.4%, a difference of 0.18%), Senegalese (11.4%, a difference of 0.19%), and West Indian (11.4%, a difference of 0.22%).
| Demographics | Rating | Rank | Male Disability |
| Estonians | 26.8 /100 | #188 | Fair 11.4% |
| Immigrants | Netherlands | 25.9 /100 | #189 | Fair 11.4% |
| Immigrants | Bosnia and Herzegovina | 25.4 /100 | #190 | Fair 11.4% |
| Senegalese | 23.2 /100 | #191 | Fair 11.4% |
| Assyrians/Chaldeans/Syriacs | 23.2 /100 | #192 | Fair 11.4% |
| Greeks | 22.2 /100 | #193 | Fair 11.4% |
| Belizeans | 21.2 /100 | #194 | Fair 11.4% |
| Immigrants | Oceania | 20.9 /100 | #195 | Fair 11.4% |
| West Indians | 18.4 /100 | #196 | Poor 11.4% |
| Somalis | 18.2 /100 | #197 | Poor 11.4% |
| Immigrants | Jamaica | 16.3 /100 | #198 | Poor 11.5% |
| Lebanese | 15.4 /100 | #199 | Poor 11.5% |
| Immigrants | Iraq | 13.0 /100 | #200 | Poor 11.5% |
| Immigrants | Panama | 13.0 /100 | #201 | Poor 11.5% |
| Immigrants | Mexico | 12.6 /100 | #202 | Poor 11.5% |