Puerto Rican vs Immigrants from Senegal Hearing Disability
COMPARE
Puerto Rican
Immigrants from Senegal
Hearing Disability
Hearing Disability Comparison
Puerto Ricans
Immigrants from Senegal
3.5%
HEARING DISABILITY
0.0/ 100
METRIC RATING
273rd/ 347
METRIC RANK
2.6%
HEARING DISABILITY
99.7/ 100
METRIC RATING
26th/ 347
METRIC RANK
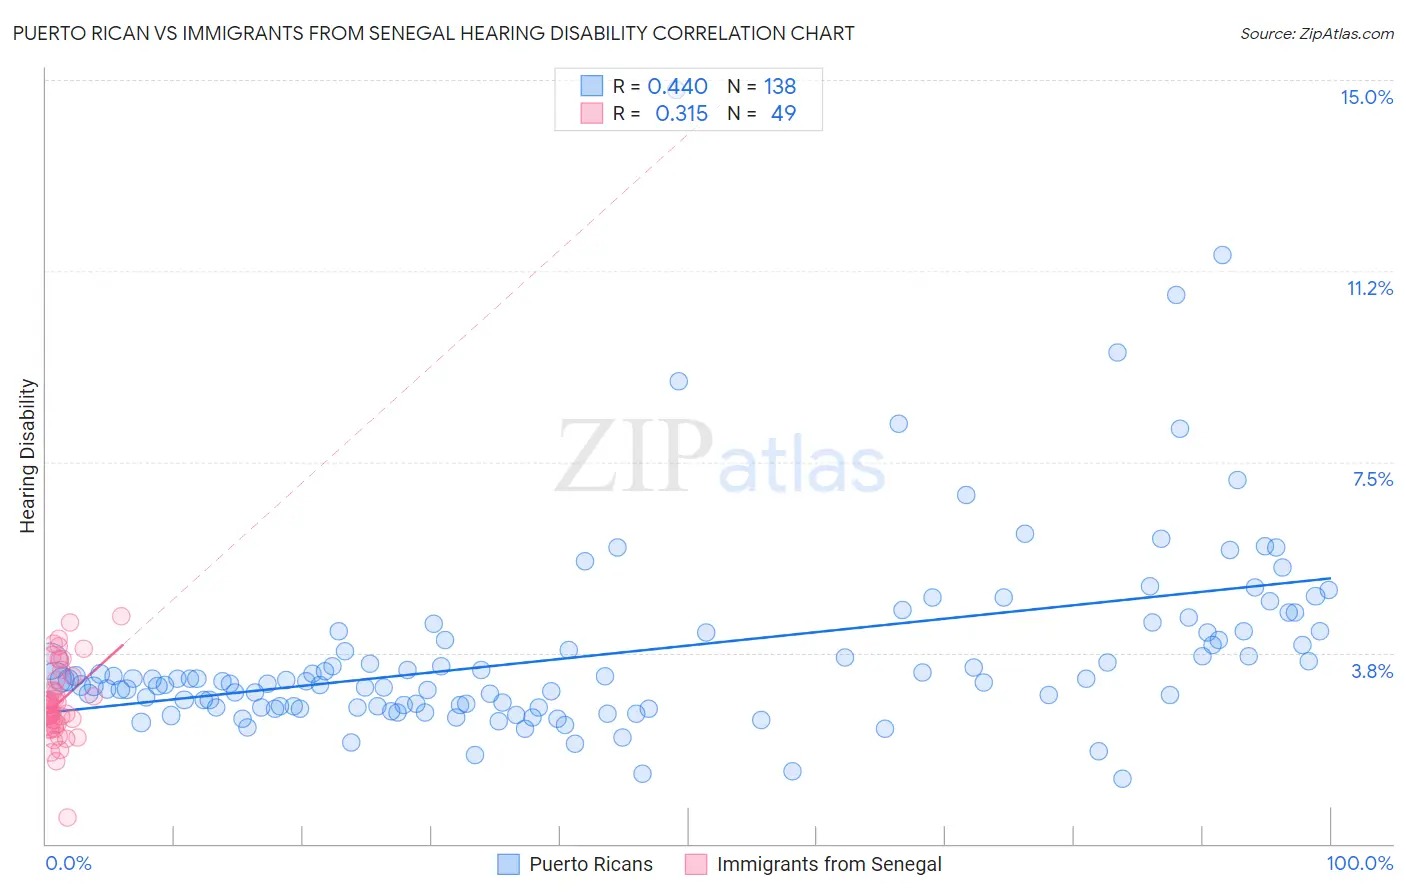
Puerto Rican vs Immigrants from Senegal Hearing Disability Correlation Chart
The statistical analysis conducted on geographies consisting of 527,769,112 people shows a moderate positive correlation between the proportion of Puerto Ricans and percentage of population with hearing disability in the United States with a correlation coefficient (R) of 0.440 and weighted average of 3.5%. Similarly, the statistical analysis conducted on geographies consisting of 90,120,921 people shows a mild positive correlation between the proportion of Immigrants from Senegal and percentage of population with hearing disability in the United States with a correlation coefficient (R) of 0.315 and weighted average of 2.6%, a difference of 36.9%.
Hearing Disability Correlation Summary
| Measurement | Puerto Rican | Immigrants from Senegal |
| Minimum | 1.3% | 0.50% |
| Maximum | 14.8% | 4.5% |
| Range | 13.5% | 4.0% |
| Mean | 3.7% | 2.8% |
| Median | 3.2% | 2.6% |
| Interquartile 25% (IQ1) | 2.7% | 2.3% |
| Interquartile 75% (IQ3) | 4.1% | 3.3% |
| Interquartile Range (IQR) | 1.4% | 0.92% |
| Standard Deviation (Sample) | 1.9% | 0.75% |
| Standard Deviation (Population) | 1.9% | 0.74% |
Similar Demographics by Hearing Disability
Demographics Similar to Puerto Ricans by Hearing Disability
In terms of hearing disability, the demographic groups most similar to Puerto Ricans are Fijian (3.5%, a difference of 0.070%), Swiss (3.5%, a difference of 0.32%), Czech (3.5%, a difference of 0.33%), Czechoslovakian (3.6%, a difference of 0.53%), and European (3.5%, a difference of 0.59%).
| Demographics | Rating | Rank | Hearing Disability |
| Belgians | 0.1 /100 | #266 | Tragic 3.5% |
| Canadians | 0.1 /100 | #267 | Tragic 3.5% |
| Spaniards | 0.1 /100 | #268 | Tragic 3.5% |
| Ute | 0.1 /100 | #269 | Tragic 3.5% |
| Europeans | 0.1 /100 | #270 | Tragic 3.5% |
| Czechs | 0.1 /100 | #271 | Tragic 3.5% |
| Fijians | 0.0 /100 | #272 | Tragic 3.5% |
| Puerto Ricans | 0.0 /100 | #273 | Tragic 3.5% |
| Swiss | 0.0 /100 | #274 | Tragic 3.5% |
| Czechoslovakians | 0.0 /100 | #275 | Tragic 3.6% |
| Danes | 0.0 /100 | #276 | Tragic 3.6% |
| Immigrants | Nonimmigrants | 0.0 /100 | #277 | Tragic 3.6% |
| Basques | 0.0 /100 | #278 | Tragic 3.6% |
| Slovaks | 0.0 /100 | #279 | Tragic 3.6% |
| French American Indians | 0.0 /100 | #280 | Tragic 3.6% |
Demographics Similar to Immigrants from Senegal by Hearing Disability
In terms of hearing disability, the demographic groups most similar to Immigrants from Senegal are Immigrants from El Salvador (2.6%, a difference of 0.010%), Immigrants from South Central Asia (2.6%, a difference of 0.040%), Immigrants from Ghana (2.6%, a difference of 0.41%), Immigrants from Haiti (2.6%, a difference of 0.41%), and Bolivian (2.6%, a difference of 0.43%).
| Demographics | Rating | Rank | Hearing Disability |
| Thais | 99.8 /100 | #19 | Exceptional 2.5% |
| Immigrants | Bolivia | 99.8 /100 | #20 | Exceptional 2.5% |
| Ghanaians | 99.8 /100 | #21 | Exceptional 2.5% |
| Immigrants | Sierra Leone | 99.8 /100 | #22 | Exceptional 2.6% |
| Immigrants | Nigeria | 99.8 /100 | #23 | Exceptional 2.6% |
| Immigrants | Ghana | 99.8 /100 | #24 | Exceptional 2.6% |
| Immigrants | El Salvador | 99.7 /100 | #25 | Exceptional 2.6% |
| Immigrants | Senegal | 99.7 /100 | #26 | Exceptional 2.6% |
| Immigrants | South Central Asia | 99.7 /100 | #27 | Exceptional 2.6% |
| Immigrants | Haiti | 99.7 /100 | #28 | Exceptional 2.6% |
| Bolivians | 99.7 /100 | #29 | Exceptional 2.6% |
| Immigrants | Caribbean | 99.7 /100 | #30 | Exceptional 2.6% |
| Immigrants | Cameroon | 99.7 /100 | #31 | Exceptional 2.6% |
| Immigrants | Venezuela | 99.7 /100 | #32 | Exceptional 2.6% |
| Filipinos | 99.6 /100 | #33 | Exceptional 2.6% |