Guatemalan vs Immigrants from Germany Vision Disability
COMPARE
Guatemalan
Immigrants from Germany
Vision Disability
Vision Disability Comparison
Guatemalans
Immigrants from Germany
2.3%
VISION DISABILITY
0.5/ 100
METRIC RATING
247th/ 347
METRIC RANK
2.3%
VISION DISABILITY
3.0/ 100
METRIC RATING
226th/ 347
METRIC RANK
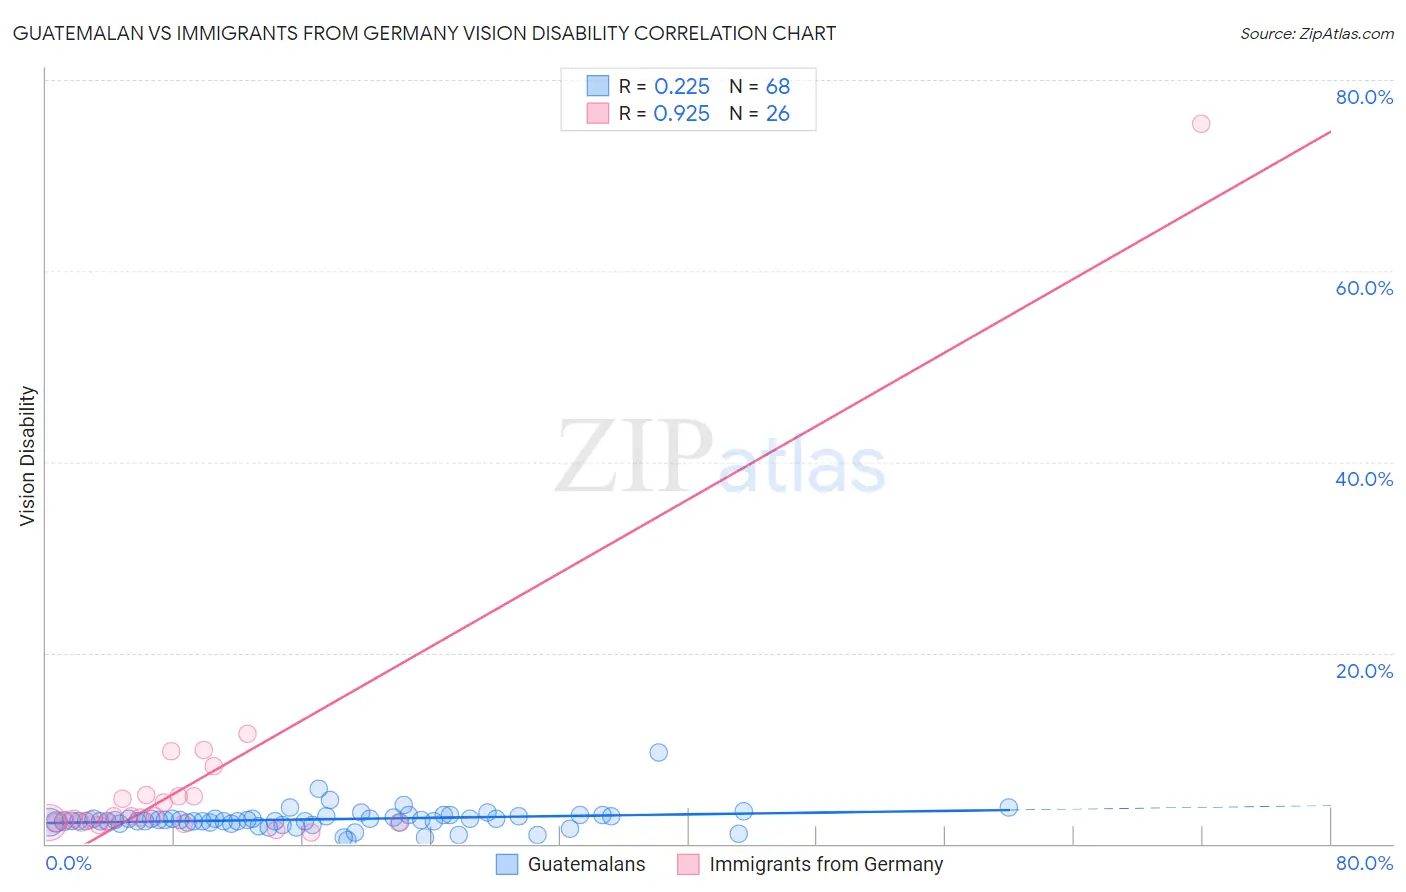
Guatemalan vs Immigrants from Germany Vision Disability Correlation Chart
The statistical analysis conducted on geographies consisting of 409,275,877 people shows a weak positive correlation between the proportion of Guatemalans and percentage of population with vision disability in the United States with a correlation coefficient (R) of 0.225 and weighted average of 2.3%. Similarly, the statistical analysis conducted on geographies consisting of 463,372,189 people shows a near-perfect positive correlation between the proportion of Immigrants from Germany and percentage of population with vision disability in the United States with a correlation coefficient (R) of 0.925 and weighted average of 2.3%, a difference of 2.7%.
Vision Disability Correlation Summary
| Measurement | Guatemalan | Immigrants from Germany |
| Minimum | 0.37% | 1.2% |
| Maximum | 9.5% | 75.4% |
| Range | 9.2% | 74.2% |
| Mean | 2.6% | 6.8% |
| Median | 2.4% | 2.8% |
| Interquartile 25% (IQ1) | 2.2% | 2.2% |
| Interquartile 75% (IQ3) | 2.8% | 5.0% |
| Interquartile Range (IQR) | 0.57% | 2.8% |
| Standard Deviation (Sample) | 1.2% | 14.3% |
| Standard Deviation (Population) | 1.2% | 14.0% |
Similar Demographics by Vision Disability
Demographics Similar to Guatemalans by Vision Disability
In terms of vision disability, the demographic groups most similar to Guatemalans are Subsaharan African (2.3%, a difference of 0.020%), Liberian (2.3%, a difference of 0.030%), French (2.3%, a difference of 0.040%), Bangladeshi (2.3%, a difference of 0.12%), and Alsatian (2.3%, a difference of 0.19%).
| Demographics | Rating | Rank | Vision Disability |
| Panamanians | 0.9 /100 | #240 | Tragic 2.3% |
| Malaysians | 0.9 /100 | #241 | Tragic 2.3% |
| Immigrants | Panama | 0.8 /100 | #242 | Tragic 2.3% |
| Immigrants | Nicaragua | 0.6 /100 | #243 | Tragic 2.3% |
| Immigrants | West Indies | 0.6 /100 | #244 | Tragic 2.3% |
| Alsatians | 0.6 /100 | #245 | Tragic 2.3% |
| French | 0.5 /100 | #246 | Tragic 2.3% |
| Guatemalans | 0.5 /100 | #247 | Tragic 2.3% |
| Sub-Saharan Africans | 0.5 /100 | #248 | Tragic 2.3% |
| Liberians | 0.5 /100 | #249 | Tragic 2.3% |
| Bangladeshis | 0.5 /100 | #250 | Tragic 2.3% |
| Immigrants | Laos | 0.4 /100 | #251 | Tragic 2.4% |
| Immigrants | Micronesia | 0.3 /100 | #252 | Tragic 2.4% |
| Japanese | 0.3 /100 | #253 | Tragic 2.4% |
| Haitians | 0.3 /100 | #254 | Tragic 2.4% |
Demographics Similar to Immigrants from Germany by Vision Disability
In terms of vision disability, the demographic groups most similar to Immigrants from Germany are Hawaiian (2.3%, a difference of 0.050%), Immigrants from Western Africa (2.3%, a difference of 0.22%), Irish (2.3%, a difference of 0.23%), Basque (2.3%, a difference of 0.26%), and Hmong (2.3%, a difference of 0.29%).
| Demographics | Rating | Rank | Vision Disability |
| Ecuadorians | 4.6 /100 | #219 | Tragic 2.3% |
| Guamanians/Chamorros | 3.9 /100 | #220 | Tragic 2.3% |
| French Canadians | 3.9 /100 | #221 | Tragic 2.3% |
| Immigrants | Senegal | 3.8 /100 | #222 | Tragic 2.3% |
| Basques | 3.5 /100 | #223 | Tragic 2.3% |
| Irish | 3.4 /100 | #224 | Tragic 2.3% |
| Immigrants | Western Africa | 3.4 /100 | #225 | Tragic 2.3% |
| Immigrants | Germany | 3.0 /100 | #226 | Tragic 2.3% |
| Hawaiians | 2.9 /100 | #227 | Tragic 2.3% |
| Hmong | 2.5 /100 | #228 | Tragic 2.3% |
| Welsh | 2.3 /100 | #229 | Tragic 2.3% |
| Nicaraguans | 2.2 /100 | #230 | Tragic 2.3% |
| Immigrants | Ecuador | 2.0 /100 | #231 | Tragic 2.3% |
| German Russians | 1.8 /100 | #232 | Tragic 2.3% |
| Central Americans | 1.8 /100 | #233 | Tragic 2.3% |