Guatemalan vs Bolivian Vision Disability
COMPARE
Guatemalan
Bolivian
Vision Disability
Vision Disability Comparison
Guatemalans
Bolivians
2.3%
VISION DISABILITY
0.5/ 100
METRIC RATING
247th/ 347
METRIC RANK
1.9%
VISION DISABILITY
100.0/ 100
METRIC RATING
18th/ 347
METRIC RANK
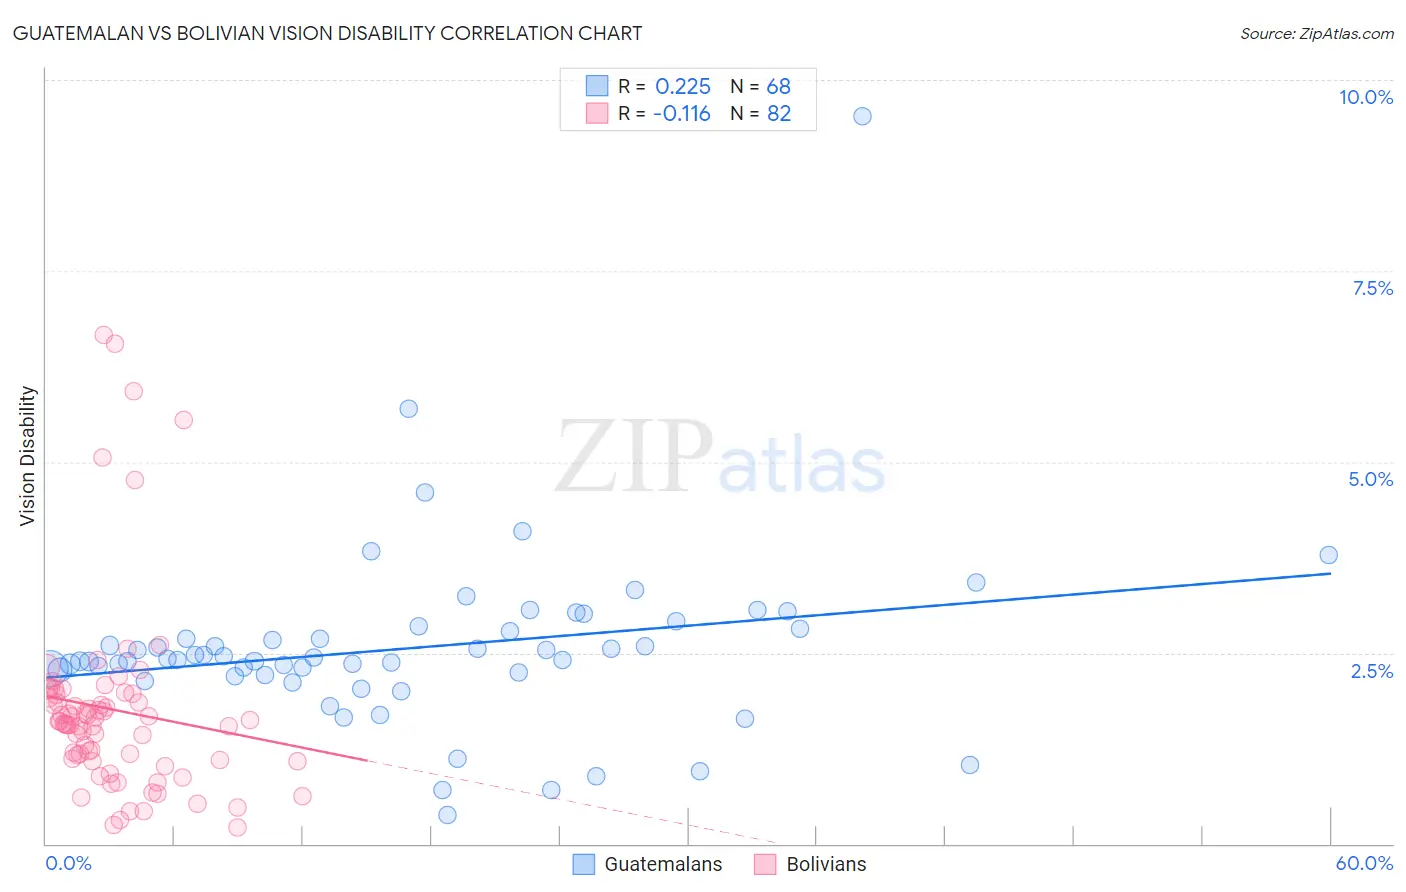
Guatemalan vs Bolivian Vision Disability Correlation Chart
The statistical analysis conducted on geographies consisting of 409,275,877 people shows a weak positive correlation between the proportion of Guatemalans and percentage of population with vision disability in the United States with a correlation coefficient (R) of 0.225 and weighted average of 2.3%. Similarly, the statistical analysis conducted on geographies consisting of 184,625,860 people shows a poor negative correlation between the proportion of Bolivians and percentage of population with vision disability in the United States with a correlation coefficient (R) of -0.116 and weighted average of 1.9%, a difference of 26.4%.
Vision Disability Correlation Summary
| Measurement | Guatemalan | Bolivian |
| Minimum | 0.37% | 0.21% |
| Maximum | 9.5% | 6.7% |
| Range | 9.2% | 6.4% |
| Mean | 2.6% | 1.8% |
| Median | 2.4% | 1.6% |
| Interquartile 25% (IQ1) | 2.2% | 1.1% |
| Interquartile 75% (IQ3) | 2.8% | 2.0% |
| Interquartile Range (IQR) | 0.57% | 0.85% |
| Standard Deviation (Sample) | 1.2% | 1.3% |
| Standard Deviation (Population) | 1.2% | 1.3% |
Similar Demographics by Vision Disability
Demographics Similar to Guatemalans by Vision Disability
In terms of vision disability, the demographic groups most similar to Guatemalans are Subsaharan African (2.3%, a difference of 0.020%), Liberian (2.3%, a difference of 0.030%), French (2.3%, a difference of 0.040%), Bangladeshi (2.3%, a difference of 0.12%), and Alsatian (2.3%, a difference of 0.19%).
| Demographics | Rating | Rank | Vision Disability |
| Panamanians | 0.9 /100 | #240 | Tragic 2.3% |
| Malaysians | 0.9 /100 | #241 | Tragic 2.3% |
| Immigrants | Panama | 0.8 /100 | #242 | Tragic 2.3% |
| Immigrants | Nicaragua | 0.6 /100 | #243 | Tragic 2.3% |
| Immigrants | West Indies | 0.6 /100 | #244 | Tragic 2.3% |
| Alsatians | 0.6 /100 | #245 | Tragic 2.3% |
| French | 0.5 /100 | #246 | Tragic 2.3% |
| Guatemalans | 0.5 /100 | #247 | Tragic 2.3% |
| Sub-Saharan Africans | 0.5 /100 | #248 | Tragic 2.3% |
| Liberians | 0.5 /100 | #249 | Tragic 2.3% |
| Bangladeshis | 0.5 /100 | #250 | Tragic 2.3% |
| Immigrants | Laos | 0.4 /100 | #251 | Tragic 2.4% |
| Immigrants | Micronesia | 0.3 /100 | #252 | Tragic 2.4% |
| Japanese | 0.3 /100 | #253 | Tragic 2.4% |
| Haitians | 0.3 /100 | #254 | Tragic 2.4% |
Demographics Similar to Bolivians by Vision Disability
In terms of vision disability, the demographic groups most similar to Bolivians are Indian (Asian) (1.8%, a difference of 0.42%), Burmese (1.8%, a difference of 0.42%), Immigrants from Bolivia (1.8%, a difference of 0.87%), Immigrants from Sri Lanka (1.9%, a difference of 1.2%), and Immigrants from China (1.8%, a difference of 1.3%).
| Demographics | Rating | Rank | Vision Disability |
| Immigrants | Israel | 100.0 /100 | #11 | Exceptional 1.8% |
| Immigrants | Korea | 100.0 /100 | #12 | Exceptional 1.8% |
| Immigrants | Eastern Asia | 100.0 /100 | #13 | Exceptional 1.8% |
| Immigrants | China | 100.0 /100 | #14 | Exceptional 1.8% |
| Immigrants | Bolivia | 100.0 /100 | #15 | Exceptional 1.8% |
| Indians (Asian) | 100.0 /100 | #16 | Exceptional 1.8% |
| Burmese | 100.0 /100 | #17 | Exceptional 1.8% |
| Bolivians | 100.0 /100 | #18 | Exceptional 1.9% |
| Immigrants | Sri Lanka | 100.0 /100 | #19 | Exceptional 1.9% |
| Asians | 100.0 /100 | #20 | Exceptional 1.9% |
| Turks | 100.0 /100 | #21 | Exceptional 1.9% |
| Immigrants | Pakistan | 100.0 /100 | #22 | Exceptional 1.9% |
| Immigrants | Asia | 99.9 /100 | #23 | Exceptional 1.9% |
| Immigrants | Lithuania | 99.9 /100 | #24 | Exceptional 1.9% |
| Bulgarians | 99.9 /100 | #25 | Exceptional 1.9% |