Guatemalan vs Immigrants from Honduras Ambulatory Disability
COMPARE
Guatemalan
Immigrants from Honduras
Ambulatory Disability
Ambulatory Disability Comparison
Guatemalans
Immigrants from Honduras
6.2%
AMBULATORY DISABILITY
30.0/ 100
METRIC RATING
193rd/ 347
METRIC RANK
6.3%
AMBULATORY DISABILITY
7.6/ 100
METRIC RATING
223rd/ 347
METRIC RANK
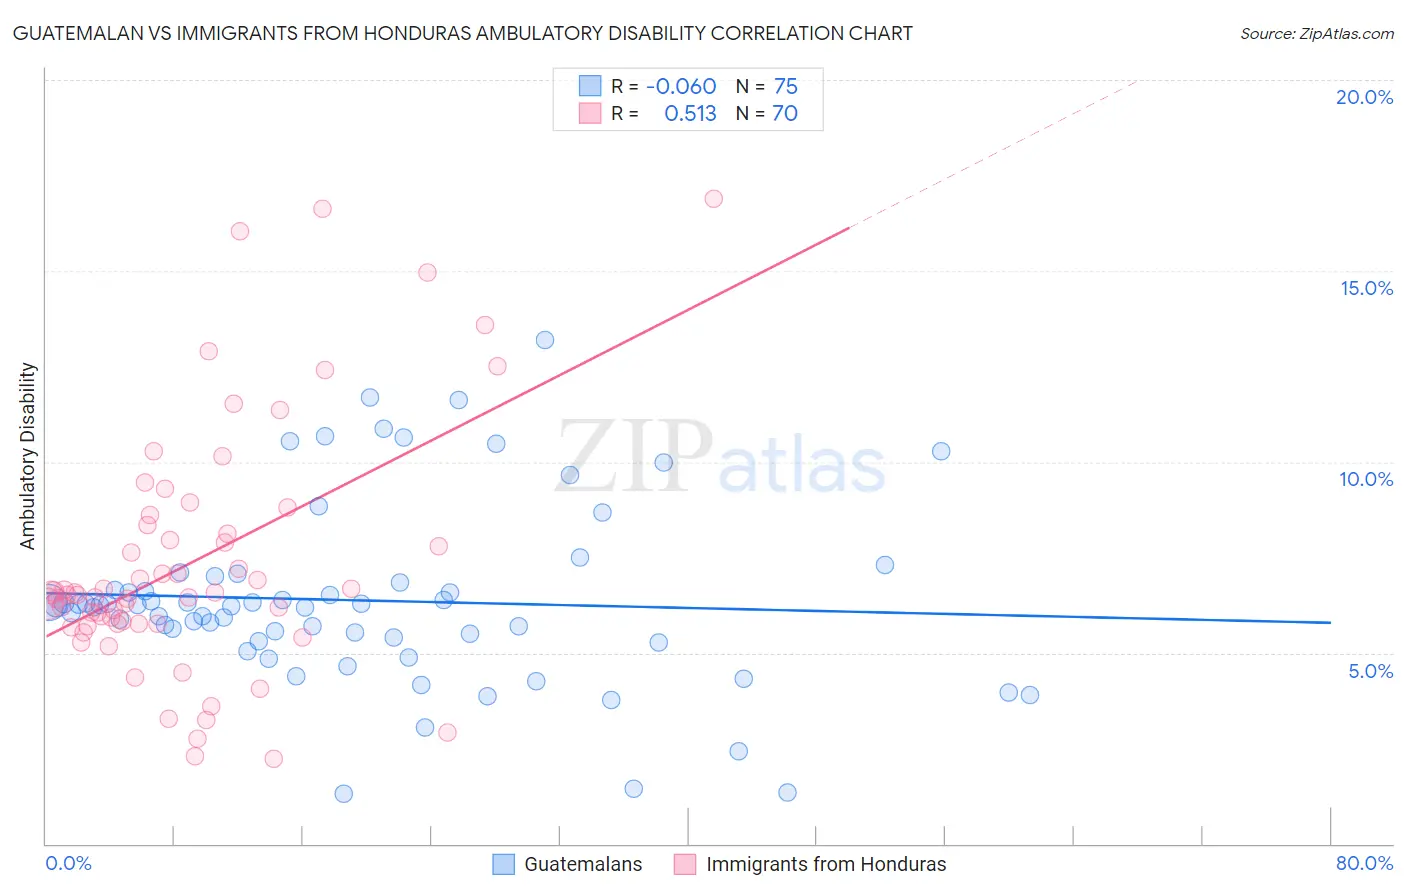
Guatemalan vs Immigrants from Honduras Ambulatory Disability Correlation Chart
The statistical analysis conducted on geographies consisting of 409,382,771 people shows a slight negative correlation between the proportion of Guatemalans and percentage of population with ambulatory disability in the United States with a correlation coefficient (R) of -0.060 and weighted average of 6.2%. Similarly, the statistical analysis conducted on geographies consisting of 322,545,499 people shows a substantial positive correlation between the proportion of Immigrants from Honduras and percentage of population with ambulatory disability in the United States with a correlation coefficient (R) of 0.513 and weighted average of 6.3%, a difference of 2.2%.
Ambulatory Disability Correlation Summary
| Measurement | Guatemalan | Immigrants from Honduras |
| Minimum | 1.3% | 2.2% |
| Maximum | 13.2% | 16.9% |
| Range | 11.9% | 14.6% |
| Mean | 6.4% | 7.4% |
| Median | 6.2% | 6.5% |
| Interquartile 25% (IQ1) | 5.3% | 5.8% |
| Interquartile 75% (IQ3) | 6.8% | 8.3% |
| Interquartile Range (IQR) | 1.5% | 2.6% |
| Standard Deviation (Sample) | 2.4% | 3.2% |
| Standard Deviation (Population) | 2.3% | 3.2% |
Similar Demographics by Ambulatory Disability
Demographics Similar to Guatemalans by Ambulatory Disability
In terms of ambulatory disability, the demographic groups most similar to Guatemalans are Alaska Native (6.2%, a difference of 0.010%), Belgian (6.2%, a difference of 0.080%), Immigrants from Western Europe (6.2%, a difference of 0.10%), Malaysian (6.2%, a difference of 0.11%), and Immigrants from Guatemala (6.2%, a difference of 0.12%).
| Demographics | Rating | Rank | Ambulatory Disability |
| Europeans | 36.2 /100 | #186 | Fair 6.2% |
| Carpatho Rusyns | 35.3 /100 | #187 | Fair 6.2% |
| British | 34.3 /100 | #188 | Fair 6.2% |
| Ukrainians | 34.0 /100 | #189 | Fair 6.2% |
| Immigrants | Western Africa | 33.4 /100 | #190 | Fair 6.2% |
| Immigrants | Guatemala | 31.9 /100 | #191 | Fair 6.2% |
| Immigrants | Western Europe | 31.6 /100 | #192 | Fair 6.2% |
| Guatemalans | 30.0 /100 | #193 | Fair 6.2% |
| Alaska Natives | 29.8 /100 | #194 | Fair 6.2% |
| Belgians | 28.6 /100 | #195 | Fair 6.2% |
| Malaysians | 28.2 /100 | #196 | Fair 6.2% |
| Poles | 26.3 /100 | #197 | Fair 6.2% |
| Immigrants | Bangladesh | 24.6 /100 | #198 | Fair 6.2% |
| Italians | 22.6 /100 | #199 | Fair 6.2% |
| Immigrants | Cambodia | 21.5 /100 | #200 | Fair 6.2% |
Demographics Similar to Immigrants from Honduras by Ambulatory Disability
In terms of ambulatory disability, the demographic groups most similar to Immigrants from Honduras are Liberian (6.3%, a difference of 0.10%), Honduran (6.3%, a difference of 0.27%), German Russian (6.3%, a difference of 0.29%), Hungarian (6.3%, a difference of 0.32%), and Immigrants from Albania (6.3%, a difference of 0.33%).
| Demographics | Rating | Rank | Ambulatory Disability |
| Canadians | 10.9 /100 | #216 | Poor 6.3% |
| Yugoslavians | 10.9 /100 | #217 | Poor 6.3% |
| Guamanians/Chamorros | 10.6 /100 | #218 | Poor 6.3% |
| Indonesians | 9.9 /100 | #219 | Tragic 6.3% |
| Immigrants | Albania | 9.6 /100 | #220 | Tragic 6.3% |
| Hungarians | 9.6 /100 | #221 | Tragic 6.3% |
| German Russians | 9.4 /100 | #222 | Tragic 6.3% |
| Immigrants | Honduras | 7.6 /100 | #223 | Tragic 6.3% |
| Liberians | 7.1 /100 | #224 | Tragic 6.3% |
| Hondurans | 6.3 /100 | #225 | Tragic 6.3% |
| Slavs | 5.1 /100 | #226 | Tragic 6.4% |
| Cubans | 4.0 /100 | #227 | Tragic 6.4% |
| Portuguese | 4.0 /100 | #228 | Tragic 6.4% |
| Czechoslovakians | 3.8 /100 | #229 | Tragic 6.4% |
| Mexicans | 3.5 /100 | #230 | Tragic 6.4% |