Guamanian/Chamorro vs Immigrants from Oceania Vision Disability
COMPARE
Guamanian/Chamorro
Immigrants from Oceania
Vision Disability
Vision Disability Comparison
Guamanians/Chamorros
Immigrants from Oceania
2.3%
VISION DISABILITY
3.9/ 100
METRIC RATING
220th/ 347
METRIC RANK
2.2%
VISION DISABILITY
45.1/ 100
METRIC RATING
178th/ 347
METRIC RANK
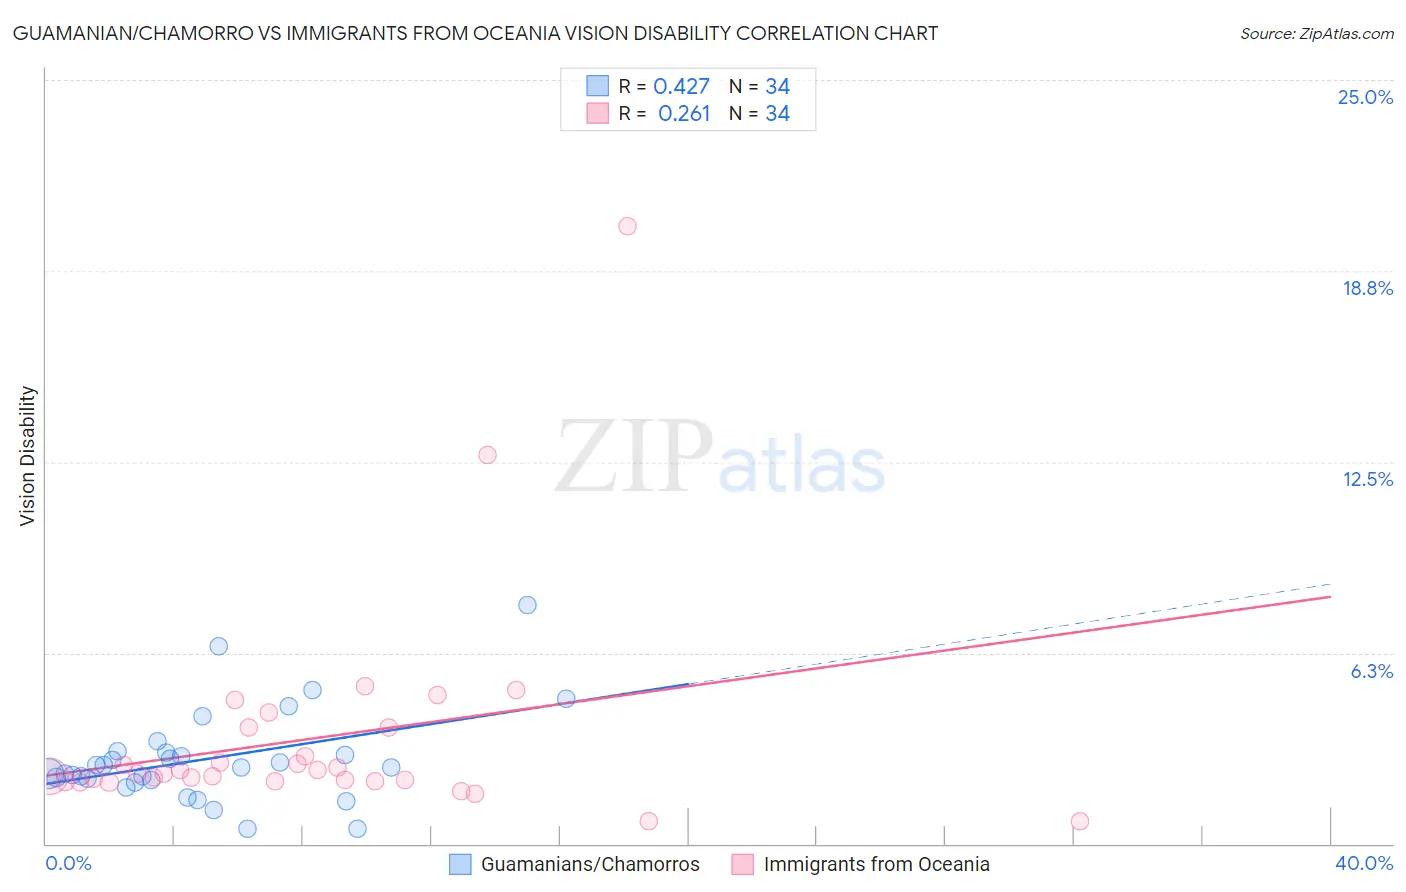
Guamanian/Chamorro vs Immigrants from Oceania Vision Disability Correlation Chart
The statistical analysis conducted on geographies consisting of 221,799,275 people shows a moderate positive correlation between the proportion of Guamanians/Chamorros and percentage of population with vision disability in the United States with a correlation coefficient (R) of 0.427 and weighted average of 2.3%. Similarly, the statistical analysis conducted on geographies consisting of 305,325,142 people shows a weak positive correlation between the proportion of Immigrants from Oceania and percentage of population with vision disability in the United States with a correlation coefficient (R) of 0.261 and weighted average of 2.2%, a difference of 4.7%.
Vision Disability Correlation Summary
| Measurement | Guamanian/Chamorro | Immigrants from Oceania |
| Minimum | 0.50% | 0.72% |
| Maximum | 7.8% | 20.2% |
| Range | 7.3% | 19.5% |
| Mean | 2.8% | 3.5% |
| Median | 2.5% | 2.3% |
| Interquartile 25% (IQ1) | 2.1% | 2.1% |
| Interquartile 75% (IQ3) | 3.0% | 3.8% |
| Interquartile Range (IQR) | 0.87% | 1.7% |
| Standard Deviation (Sample) | 1.5% | 3.6% |
| Standard Deviation (Population) | 1.5% | 3.5% |
Similar Demographics by Vision Disability
Demographics Similar to Guamanians/Chamorros by Vision Disability
In terms of vision disability, the demographic groups most similar to Guamanians/Chamorros are French Canadian (2.3%, a difference of 0.020%), Immigrants from Senegal (2.3%, a difference of 0.040%), Basque (2.3%, a difference of 0.18%), Irish (2.3%, a difference of 0.20%), and Immigrants from Western Africa (2.3%, a difference of 0.22%).
| Demographics | Rating | Rank | Vision Disability |
| Immigrants | Ghana | 8.9 /100 | #213 | Tragic 2.2% |
| Trinidadians and Tobagonians | 8.2 /100 | #214 | Tragic 2.2% |
| Nigerians | 7.2 /100 | #215 | Tragic 2.3% |
| Immigrants | Trinidad and Tobago | 6.1 /100 | #216 | Tragic 2.3% |
| Barbadians | 5.1 /100 | #217 | Tragic 2.3% |
| Portuguese | 4.9 /100 | #218 | Tragic 2.3% |
| Ecuadorians | 4.6 /100 | #219 | Tragic 2.3% |
| Guamanians/Chamorros | 3.9 /100 | #220 | Tragic 2.3% |
| French Canadians | 3.9 /100 | #221 | Tragic 2.3% |
| Immigrants | Senegal | 3.8 /100 | #222 | Tragic 2.3% |
| Basques | 3.5 /100 | #223 | Tragic 2.3% |
| Irish | 3.4 /100 | #224 | Tragic 2.3% |
| Immigrants | Western Africa | 3.4 /100 | #225 | Tragic 2.3% |
| Immigrants | Germany | 3.0 /100 | #226 | Tragic 2.3% |
| Hawaiians | 2.9 /100 | #227 | Tragic 2.3% |
Demographics Similar to Immigrants from Oceania by Vision Disability
In terms of vision disability, the demographic groups most similar to Immigrants from Oceania are Immigrants from North America (2.2%, a difference of 0.040%), Slavic (2.2%, a difference of 0.050%), Yugoslavian (2.2%, a difference of 0.090%), Immigrants from Fiji (2.2%, a difference of 0.16%), and Uruguayan (2.2%, a difference of 0.16%).
| Demographics | Rating | Rank | Vision Disability |
| Lebanese | 54.3 /100 | #171 | Average 2.2% |
| Northern Europeans | 50.1 /100 | #172 | Average 2.2% |
| Scandinavians | 50.0 /100 | #173 | Average 2.2% |
| Immigrants | Canada | 50.0 /100 | #174 | Average 2.2% |
| Immigrants | Fiji | 47.6 /100 | #175 | Average 2.2% |
| Yugoslavians | 46.5 /100 | #176 | Average 2.2% |
| Slavs | 46.0 /100 | #177 | Average 2.2% |
| Immigrants | Oceania | 45.1 /100 | #178 | Average 2.2% |
| Immigrants | North America | 44.5 /100 | #179 | Average 2.2% |
| Uruguayans | 42.7 /100 | #180 | Average 2.2% |
| Immigrants | Western Europe | 41.1 /100 | #181 | Average 2.2% |
| Costa Ricans | 40.7 /100 | #182 | Average 2.2% |
| Immigrants | Burma/Myanmar | 37.9 /100 | #183 | Fair 2.2% |
| Moroccans | 35.4 /100 | #184 | Fair 2.2% |
| Immigrants | Middle Africa | 33.5 /100 | #185 | Fair 2.2% |