Pennsylvania German vs Immigrants from Oceania Vision Disability
COMPARE
Pennsylvania German
Immigrants from Oceania
Vision Disability
Vision Disability Comparison
Pennsylvania Germans
Immigrants from Oceania
2.2%
VISION DISABILITY
14.5/ 100
METRIC RATING
206th/ 347
METRIC RANK
2.2%
VISION DISABILITY
45.1/ 100
METRIC RATING
178th/ 347
METRIC RANK
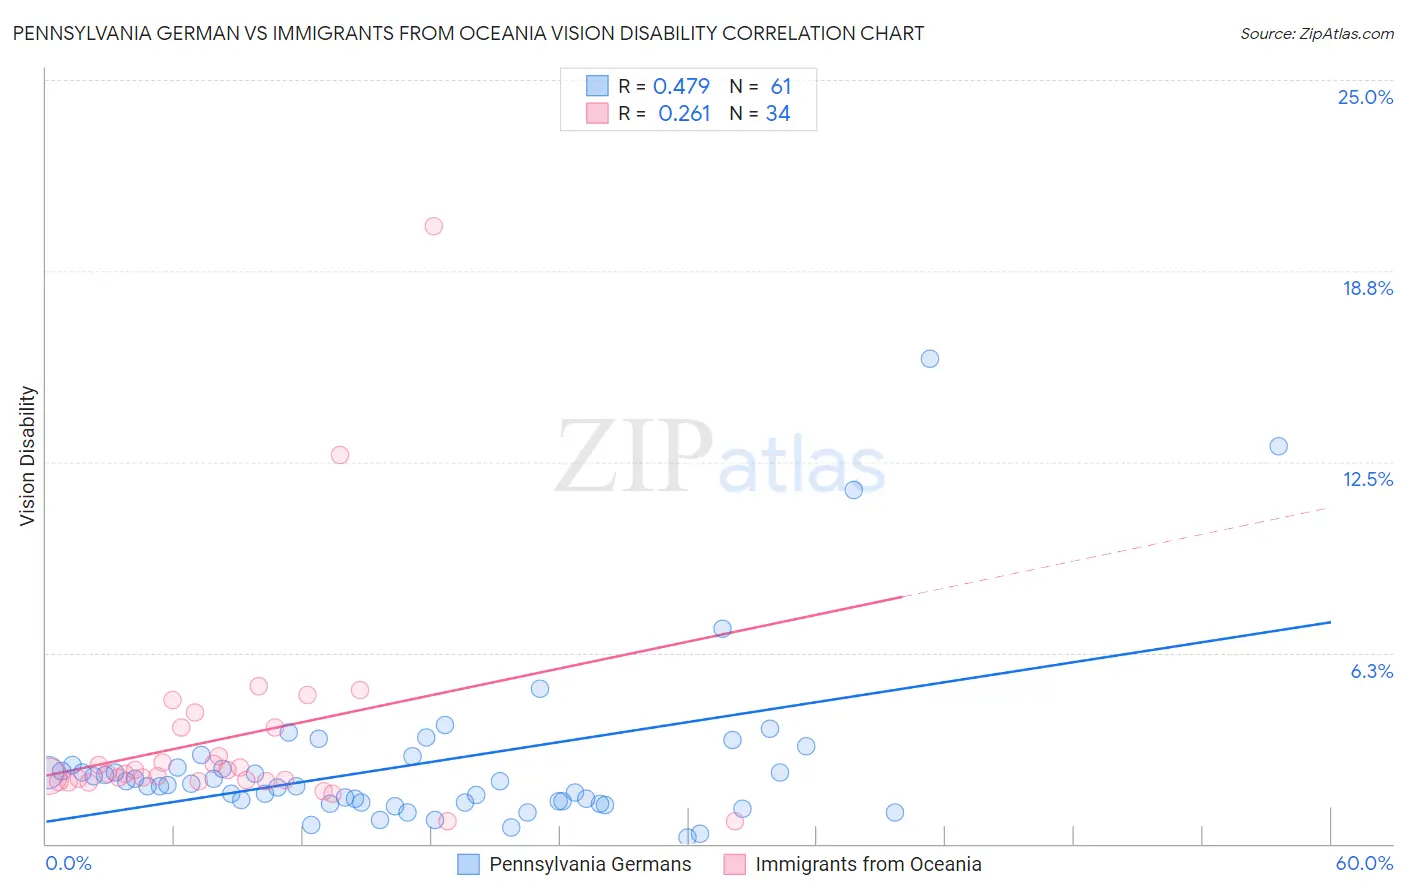
Pennsylvania German vs Immigrants from Oceania Vision Disability Correlation Chart
The statistical analysis conducted on geographies consisting of 233,923,332 people shows a moderate positive correlation between the proportion of Pennsylvania Germans and percentage of population with vision disability in the United States with a correlation coefficient (R) of 0.479 and weighted average of 2.2%. Similarly, the statistical analysis conducted on geographies consisting of 305,325,142 people shows a weak positive correlation between the proportion of Immigrants from Oceania and percentage of population with vision disability in the United States with a correlation coefficient (R) of 0.261 and weighted average of 2.2%, a difference of 2.5%.
Vision Disability Correlation Summary
| Measurement | Pennsylvania German | Immigrants from Oceania |
| Minimum | 0.20% | 0.72% |
| Maximum | 15.9% | 20.2% |
| Range | 15.7% | 19.5% |
| Mean | 2.6% | 3.5% |
| Median | 1.9% | 2.3% |
| Interquartile 25% (IQ1) | 1.4% | 2.1% |
| Interquartile 75% (IQ3) | 2.6% | 3.8% |
| Interquartile Range (IQR) | 1.2% | 1.7% |
| Standard Deviation (Sample) | 2.8% | 3.6% |
| Standard Deviation (Population) | 2.7% | 3.5% |
Similar Demographics by Vision Disability
Demographics Similar to Pennsylvania Germans by Vision Disability
In terms of vision disability, the demographic groups most similar to Pennsylvania Germans are Immigrants from Nigeria (2.2%, a difference of 0.13%), Samoan (2.2%, a difference of 0.14%), German (2.2%, a difference of 0.14%), Immigrants from Guyana (2.2%, a difference of 0.17%), and Immigrants from Brazil (2.2%, a difference of 0.18%).
| Demographics | Rating | Rank | Vision Disability |
| Immigrants | El Salvador | 21.0 /100 | #199 | Fair 2.2% |
| Immigrants | Thailand | 20.1 /100 | #200 | Fair 2.2% |
| Slovaks | 18.8 /100 | #201 | Poor 2.2% |
| Immigrants | Zaire | 18.0 /100 | #202 | Poor 2.2% |
| Dutch | 17.1 /100 | #203 | Poor 2.2% |
| Immigrants | Guyana | 15.9 /100 | #204 | Poor 2.2% |
| Samoans | 15.7 /100 | #205 | Poor 2.2% |
| Pennsylvania Germans | 14.5 /100 | #206 | Poor 2.2% |
| Immigrants | Nigeria | 13.5 /100 | #207 | Poor 2.2% |
| Germans | 13.4 /100 | #208 | Poor 2.2% |
| Immigrants | Brazil | 13.1 /100 | #209 | Poor 2.2% |
| Immigrants | Uruguay | 11.5 /100 | #210 | Poor 2.2% |
| Indonesians | 9.5 /100 | #211 | Tragic 2.2% |
| Bermudans | 9.0 /100 | #212 | Tragic 2.2% |
| Immigrants | Ghana | 8.9 /100 | #213 | Tragic 2.2% |
Demographics Similar to Immigrants from Oceania by Vision Disability
In terms of vision disability, the demographic groups most similar to Immigrants from Oceania are Immigrants from North America (2.2%, a difference of 0.040%), Slavic (2.2%, a difference of 0.050%), Yugoslavian (2.2%, a difference of 0.090%), Immigrants from Fiji (2.2%, a difference of 0.16%), and Uruguayan (2.2%, a difference of 0.16%).
| Demographics | Rating | Rank | Vision Disability |
| Lebanese | 54.3 /100 | #171 | Average 2.2% |
| Northern Europeans | 50.1 /100 | #172 | Average 2.2% |
| Scandinavians | 50.0 /100 | #173 | Average 2.2% |
| Immigrants | Canada | 50.0 /100 | #174 | Average 2.2% |
| Immigrants | Fiji | 47.6 /100 | #175 | Average 2.2% |
| Yugoslavians | 46.5 /100 | #176 | Average 2.2% |
| Slavs | 46.0 /100 | #177 | Average 2.2% |
| Immigrants | Oceania | 45.1 /100 | #178 | Average 2.2% |
| Immigrants | North America | 44.5 /100 | #179 | Average 2.2% |
| Uruguayans | 42.7 /100 | #180 | Average 2.2% |
| Immigrants | Western Europe | 41.1 /100 | #181 | Average 2.2% |
| Costa Ricans | 40.7 /100 | #182 | Average 2.2% |
| Immigrants | Burma/Myanmar | 37.9 /100 | #183 | Fair 2.2% |
| Moroccans | 35.4 /100 | #184 | Fair 2.2% |
| Immigrants | Middle Africa | 33.5 /100 | #185 | Fair 2.2% |