Guamanian/Chamorro vs Seminole Vision Disability
COMPARE
Guamanian/Chamorro
Seminole
Vision Disability
Vision Disability Comparison
Guamanians/Chamorros
Seminole
2.3%
VISION DISABILITY
3.9/ 100
METRIC RATING
220th/ 347
METRIC RANK
3.1%
VISION DISABILITY
0.0/ 100
METRIC RATING
332nd/ 347
METRIC RANK
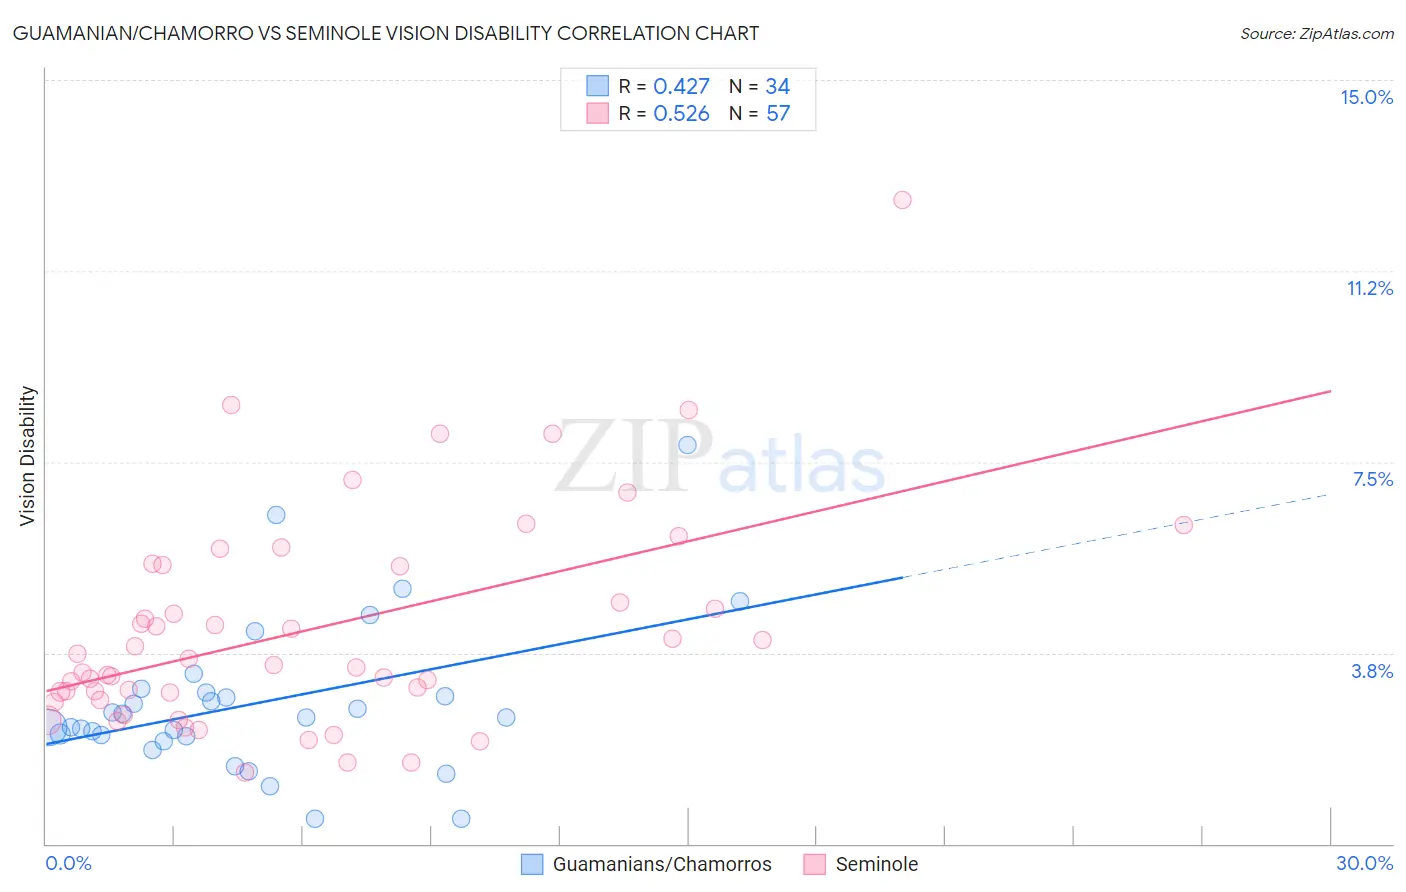
Guamanian/Chamorro vs Seminole Vision Disability Correlation Chart
The statistical analysis conducted on geographies consisting of 221,799,275 people shows a moderate positive correlation between the proportion of Guamanians/Chamorros and percentage of population with vision disability in the United States with a correlation coefficient (R) of 0.427 and weighted average of 2.3%. Similarly, the statistical analysis conducted on geographies consisting of 118,301,889 people shows a substantial positive correlation between the proportion of Seminole and percentage of population with vision disability in the United States with a correlation coefficient (R) of 0.526 and weighted average of 3.1%, a difference of 34.4%.
Vision Disability Correlation Summary
| Measurement | Guamanian/Chamorro | Seminole |
| Minimum | 0.50% | 1.4% |
| Maximum | 7.8% | 12.6% |
| Range | 7.3% | 11.2% |
| Mean | 2.8% | 4.2% |
| Median | 2.5% | 3.5% |
| Interquartile 25% (IQ1) | 2.1% | 2.9% |
| Interquartile 75% (IQ3) | 3.0% | 5.5% |
| Interquartile Range (IQR) | 0.87% | 2.6% |
| Standard Deviation (Sample) | 1.5% | 2.1% |
| Standard Deviation (Population) | 1.5% | 2.1% |
Similar Demographics by Vision Disability
Demographics Similar to Guamanians/Chamorros by Vision Disability
In terms of vision disability, the demographic groups most similar to Guamanians/Chamorros are French Canadian (2.3%, a difference of 0.020%), Immigrants from Senegal (2.3%, a difference of 0.040%), Basque (2.3%, a difference of 0.18%), Irish (2.3%, a difference of 0.20%), and Immigrants from Western Africa (2.3%, a difference of 0.22%).
| Demographics | Rating | Rank | Vision Disability |
| Immigrants | Ghana | 8.9 /100 | #213 | Tragic 2.2% |
| Trinidadians and Tobagonians | 8.2 /100 | #214 | Tragic 2.2% |
| Nigerians | 7.2 /100 | #215 | Tragic 2.3% |
| Immigrants | Trinidad and Tobago | 6.1 /100 | #216 | Tragic 2.3% |
| Barbadians | 5.1 /100 | #217 | Tragic 2.3% |
| Portuguese | 4.9 /100 | #218 | Tragic 2.3% |
| Ecuadorians | 4.6 /100 | #219 | Tragic 2.3% |
| Guamanians/Chamorros | 3.9 /100 | #220 | Tragic 2.3% |
| French Canadians | 3.9 /100 | #221 | Tragic 2.3% |
| Immigrants | Senegal | 3.8 /100 | #222 | Tragic 2.3% |
| Basques | 3.5 /100 | #223 | Tragic 2.3% |
| Irish | 3.4 /100 | #224 | Tragic 2.3% |
| Immigrants | Western Africa | 3.4 /100 | #225 | Tragic 2.3% |
| Immigrants | Germany | 3.0 /100 | #226 | Tragic 2.3% |
| Hawaiians | 2.9 /100 | #227 | Tragic 2.3% |
Demographics Similar to Seminole by Vision Disability
In terms of vision disability, the demographic groups most similar to Seminole are Cajun (3.1%, a difference of 0.010%), Central American Indian (3.0%, a difference of 0.43%), Colville (3.0%, a difference of 1.1%), Cheyenne (3.1%, a difference of 1.1%), and Apache (3.0%, a difference of 2.3%).
| Demographics | Rating | Rank | Vision Disability |
| Cherokee | 0.0 /100 | #325 | Tragic 2.9% |
| Spanish Americans | 0.0 /100 | #326 | Tragic 2.9% |
| Natives/Alaskans | 0.0 /100 | #327 | Tragic 3.0% |
| Yuman | 0.0 /100 | #328 | Tragic 3.0% |
| Apache | 0.0 /100 | #329 | Tragic 3.0% |
| Colville | 0.0 /100 | #330 | Tragic 3.0% |
| Central American Indians | 0.0 /100 | #331 | Tragic 3.0% |
| Seminole | 0.0 /100 | #332 | Tragic 3.1% |
| Cajuns | 0.0 /100 | #333 | Tragic 3.1% |
| Cheyenne | 0.0 /100 | #334 | Tragic 3.1% |
| Navajo | 0.0 /100 | #335 | Tragic 3.1% |
| Alaskan Athabascans | 0.0 /100 | #336 | Tragic 3.1% |
| Dutch West Indians | 0.0 /100 | #337 | Tragic 3.2% |
| Chickasaw | 0.0 /100 | #338 | Tragic 3.2% |
| Tsimshian | 0.0 /100 | #339 | Tragic 3.2% |