Guamanian/Chamorro vs Immigrants from Oceania 9th Grade
COMPARE
Guamanian/Chamorro
Immigrants from Oceania
9th Grade
9th Grade Comparison
Guamanians/Chamorros
Immigrants from Oceania
94.8%
9TH GRADE
35.5/ 100
METRIC RATING
187th/ 347
METRIC RANK
94.5%
9TH GRADE
12.1/ 100
METRIC RATING
213th/ 347
METRIC RANK
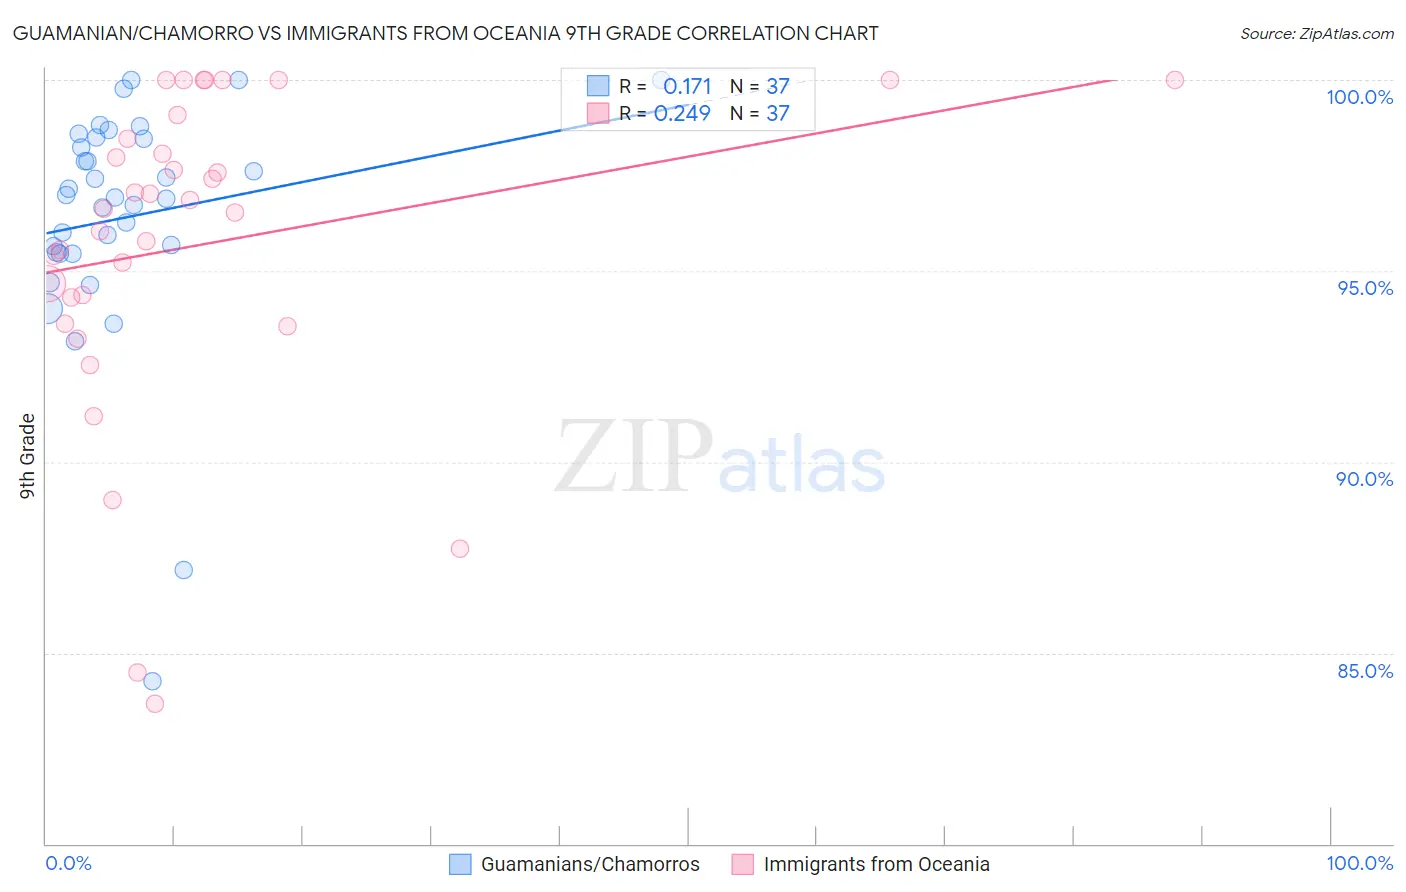
Guamanian/Chamorro vs Immigrants from Oceania 9th Grade Correlation Chart
The statistical analysis conducted on geographies consisting of 221,965,618 people shows a poor positive correlation between the proportion of Guamanians/Chamorros and percentage of population with at least 9th grade education in the United States with a correlation coefficient (R) of 0.171 and weighted average of 94.8%. Similarly, the statistical analysis conducted on geographies consisting of 305,521,521 people shows a weak positive correlation between the proportion of Immigrants from Oceania and percentage of population with at least 9th grade education in the United States with a correlation coefficient (R) of 0.249 and weighted average of 94.5%, a difference of 0.26%.
9th Grade Correlation Summary
| Measurement | Guamanian/Chamorro | Immigrants from Oceania |
| Minimum | 84.3% | 83.7% |
| Maximum | 100.0% | 100.0% |
| Range | 15.7% | 16.3% |
| Mean | 96.4% | 95.7% |
| Median | 96.9% | 96.6% |
| Interquartile 25% (IQ1) | 95.5% | 94.0% |
| Interquartile 75% (IQ3) | 98.5% | 98.8% |
| Interquartile Range (IQR) | 3.0% | 4.8% |
| Standard Deviation (Sample) | 3.2% | 4.2% |
| Standard Deviation (Population) | 3.1% | 4.1% |
Similar Demographics by 9th Grade
Demographics Similar to Guamanians/Chamorros by 9th Grade
In terms of 9th grade, the demographic groups most similar to Guamanians/Chamorros are Hopi (94.8%, a difference of 0.010%), Immigrants from Albania (94.8%, a difference of 0.010%), Immigrants from Argentina (94.8%, a difference of 0.010%), Argentinean (94.8%, a difference of 0.020%), and Liberian (94.8%, a difference of 0.020%).
| Demographics | Rating | Rank | 9th Grade |
| Immigrants | Uganda | 43.1 /100 | #180 | Average 94.8% |
| Sierra Leoneans | 42.7 /100 | #181 | Average 94.8% |
| Seminole | 42.5 /100 | #182 | Average 94.8% |
| Immigrants | Nepal | 39.7 /100 | #183 | Fair 94.8% |
| Argentineans | 37.6 /100 | #184 | Fair 94.8% |
| Liberians | 37.4 /100 | #185 | Fair 94.8% |
| Hopi | 37.1 /100 | #186 | Fair 94.8% |
| Guamanians/Chamorros | 35.5 /100 | #187 | Fair 94.8% |
| Immigrants | Albania | 34.5 /100 | #188 | Fair 94.8% |
| Immigrants | Argentina | 34.4 /100 | #189 | Fair 94.8% |
| Sudanese | 32.7 /100 | #190 | Fair 94.7% |
| Assyrians/Chaldeans/Syriacs | 32.0 /100 | #191 | Fair 94.7% |
| Immigrants | Northern Africa | 30.7 /100 | #192 | Fair 94.7% |
| Paraguayans | 30.1 /100 | #193 | Fair 94.7% |
| Panamanians | 29.0 /100 | #194 | Fair 94.7% |
Demographics Similar to Immigrants from Oceania by 9th Grade
In terms of 9th grade, the demographic groups most similar to Immigrants from Oceania are Immigrants from Indonesia (94.5%, a difference of 0.0%), Immigrants from Malaysia (94.5%, a difference of 0.0%), Immigrants from Liberia (94.5%, a difference of 0.0%), Immigrants from Chile (94.5%, a difference of 0.020%), and Immigrants from Syria (94.5%, a difference of 0.020%).
| Demographics | Rating | Rank | 9th Grade |
| Samoans | 17.3 /100 | #206 | Poor 94.6% |
| Immigrants | Morocco | 16.3 /100 | #207 | Poor 94.6% |
| Immigrants | Pakistan | 15.5 /100 | #208 | Poor 94.6% |
| Comanche | 14.9 /100 | #209 | Poor 94.6% |
| Immigrants | Chile | 13.4 /100 | #210 | Poor 94.5% |
| Immigrants | Indonesia | 12.3 /100 | #211 | Poor 94.5% |
| Immigrants | Malaysia | 12.2 /100 | #212 | Poor 94.5% |
| Immigrants | Oceania | 12.1 /100 | #213 | Poor 94.5% |
| Immigrants | Liberia | 11.8 /100 | #214 | Poor 94.5% |
| Immigrants | Syria | 11.0 /100 | #215 | Poor 94.5% |
| Immigrants | Western Asia | 10.7 /100 | #216 | Poor 94.5% |
| Asians | 9.9 /100 | #217 | Tragic 94.5% |
| Portuguese | 9.2 /100 | #218 | Tragic 94.5% |
| Africans | 9.0 /100 | #219 | Tragic 94.5% |
| Indians (Asian) | 8.6 /100 | #220 | Tragic 94.5% |