Guamanian/Chamorro vs Alsatian Vision Disability
COMPARE
Guamanian/Chamorro
Alsatian
Vision Disability
Vision Disability Comparison
Guamanians/Chamorros
Alsatians
2.3%
VISION DISABILITY
3.9/ 100
METRIC RATING
220th/ 347
METRIC RANK
2.3%
VISION DISABILITY
0.6/ 100
METRIC RATING
245th/ 347
METRIC RANK
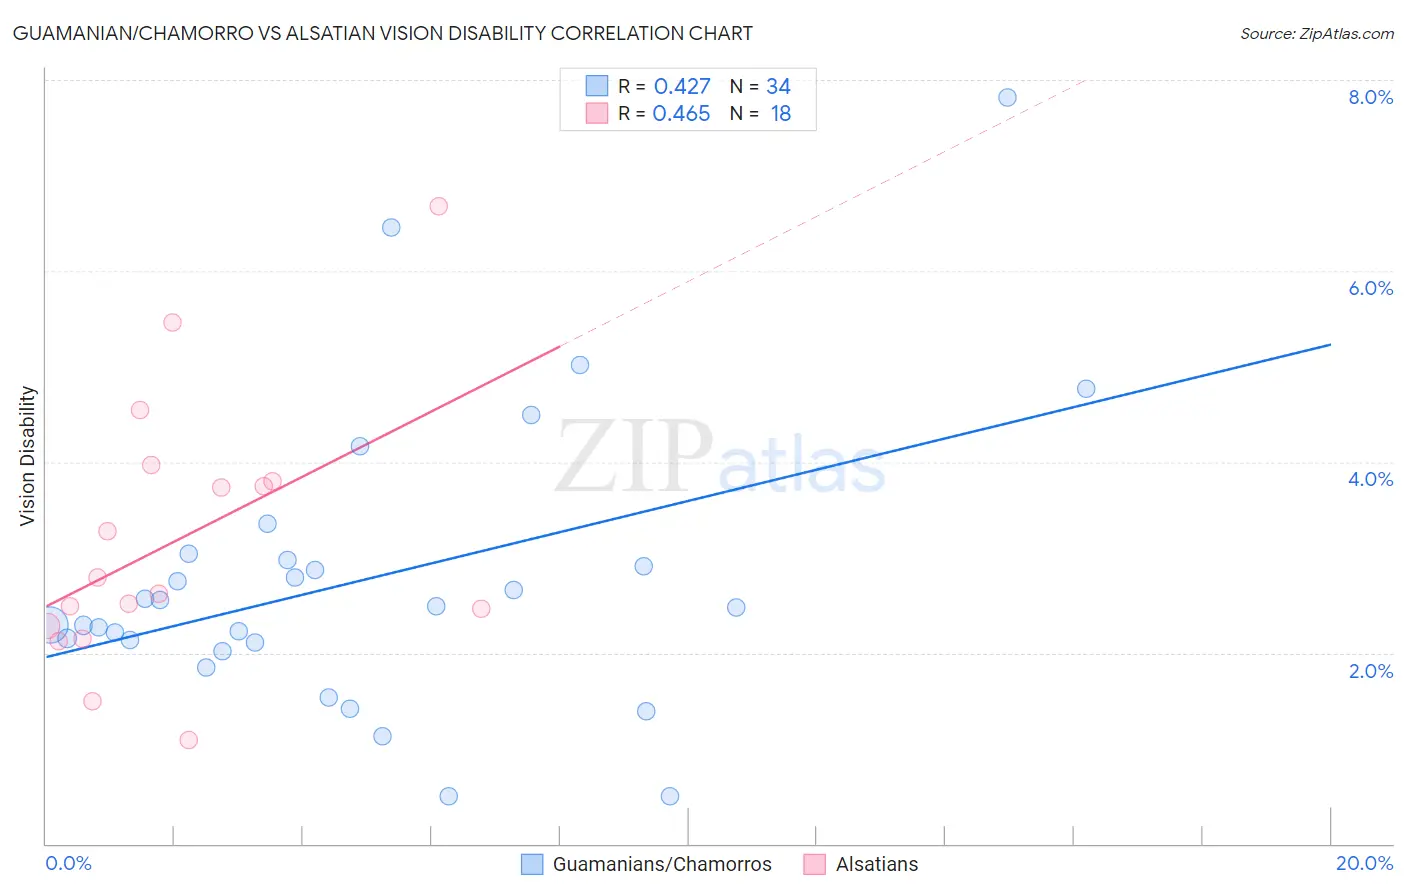
Guamanian/Chamorro vs Alsatian Vision Disability Correlation Chart
The statistical analysis conducted on geographies consisting of 221,799,275 people shows a moderate positive correlation between the proportion of Guamanians/Chamorros and percentage of population with vision disability in the United States with a correlation coefficient (R) of 0.427 and weighted average of 2.3%. Similarly, the statistical analysis conducted on geographies consisting of 82,677,708 people shows a moderate positive correlation between the proportion of Alsatians and percentage of population with vision disability in the United States with a correlation coefficient (R) of 0.465 and weighted average of 2.3%, a difference of 2.9%.
Vision Disability Correlation Summary
| Measurement | Guamanian/Chamorro | Alsatian |
| Minimum | 0.50% | 1.1% |
| Maximum | 7.8% | 6.7% |
| Range | 7.3% | 5.6% |
| Mean | 2.8% | 3.2% |
| Median | 2.5% | 2.7% |
| Interquartile 25% (IQ1) | 2.1% | 2.3% |
| Interquartile 75% (IQ3) | 3.0% | 3.8% |
| Interquartile Range (IQR) | 0.87% | 1.5% |
| Standard Deviation (Sample) | 1.5% | 1.4% |
| Standard Deviation (Population) | 1.5% | 1.4% |
Similar Demographics by Vision Disability
Demographics Similar to Guamanians/Chamorros by Vision Disability
In terms of vision disability, the demographic groups most similar to Guamanians/Chamorros are French Canadian (2.3%, a difference of 0.020%), Immigrants from Senegal (2.3%, a difference of 0.040%), Basque (2.3%, a difference of 0.18%), Irish (2.3%, a difference of 0.20%), and Immigrants from Western Africa (2.3%, a difference of 0.22%).
| Demographics | Rating | Rank | Vision Disability |
| Immigrants | Ghana | 8.9 /100 | #213 | Tragic 2.2% |
| Trinidadians and Tobagonians | 8.2 /100 | #214 | Tragic 2.2% |
| Nigerians | 7.2 /100 | #215 | Tragic 2.3% |
| Immigrants | Trinidad and Tobago | 6.1 /100 | #216 | Tragic 2.3% |
| Barbadians | 5.1 /100 | #217 | Tragic 2.3% |
| Portuguese | 4.9 /100 | #218 | Tragic 2.3% |
| Ecuadorians | 4.6 /100 | #219 | Tragic 2.3% |
| Guamanians/Chamorros | 3.9 /100 | #220 | Tragic 2.3% |
| French Canadians | 3.9 /100 | #221 | Tragic 2.3% |
| Immigrants | Senegal | 3.8 /100 | #222 | Tragic 2.3% |
| Basques | 3.5 /100 | #223 | Tragic 2.3% |
| Irish | 3.4 /100 | #224 | Tragic 2.3% |
| Immigrants | Western Africa | 3.4 /100 | #225 | Tragic 2.3% |
| Immigrants | Germany | 3.0 /100 | #226 | Tragic 2.3% |
| Hawaiians | 2.9 /100 | #227 | Tragic 2.3% |
Demographics Similar to Alsatians by Vision Disability
In terms of vision disability, the demographic groups most similar to Alsatians are Immigrants from Nicaragua (2.3%, a difference of 0.090%), Immigrants from West Indies (2.3%, a difference of 0.090%), French (2.3%, a difference of 0.15%), Guatemalan (2.3%, a difference of 0.19%), and Subsaharan African (2.3%, a difference of 0.21%).
| Demographics | Rating | Rank | Vision Disability |
| Immigrants | Cambodia | 1.1 /100 | #238 | Tragic 2.3% |
| English | 1.1 /100 | #239 | Tragic 2.3% |
| Panamanians | 0.9 /100 | #240 | Tragic 2.3% |
| Malaysians | 0.9 /100 | #241 | Tragic 2.3% |
| Immigrants | Panama | 0.8 /100 | #242 | Tragic 2.3% |
| Immigrants | Nicaragua | 0.6 /100 | #243 | Tragic 2.3% |
| Immigrants | West Indies | 0.6 /100 | #244 | Tragic 2.3% |
| Alsatians | 0.6 /100 | #245 | Tragic 2.3% |
| French | 0.5 /100 | #246 | Tragic 2.3% |
| Guatemalans | 0.5 /100 | #247 | Tragic 2.3% |
| Sub-Saharan Africans | 0.5 /100 | #248 | Tragic 2.3% |
| Liberians | 0.5 /100 | #249 | Tragic 2.3% |
| Bangladeshis | 0.5 /100 | #250 | Tragic 2.3% |
| Immigrants | Laos | 0.4 /100 | #251 | Tragic 2.4% |
| Immigrants | Micronesia | 0.3 /100 | #252 | Tragic 2.4% |