Guamanian/Chamorro vs Immigrants from Denmark 6th Grade
COMPARE
Guamanian/Chamorro
Immigrants from Denmark
6th Grade
6th Grade Comparison
Guamanians/Chamorros
Immigrants from Denmark
97.0%
6TH GRADE
30.6/ 100
METRIC RATING
187th/ 347
METRIC RANK
97.5%
6TH GRADE
98.5/ 100
METRIC RATING
98th/ 347
METRIC RANK
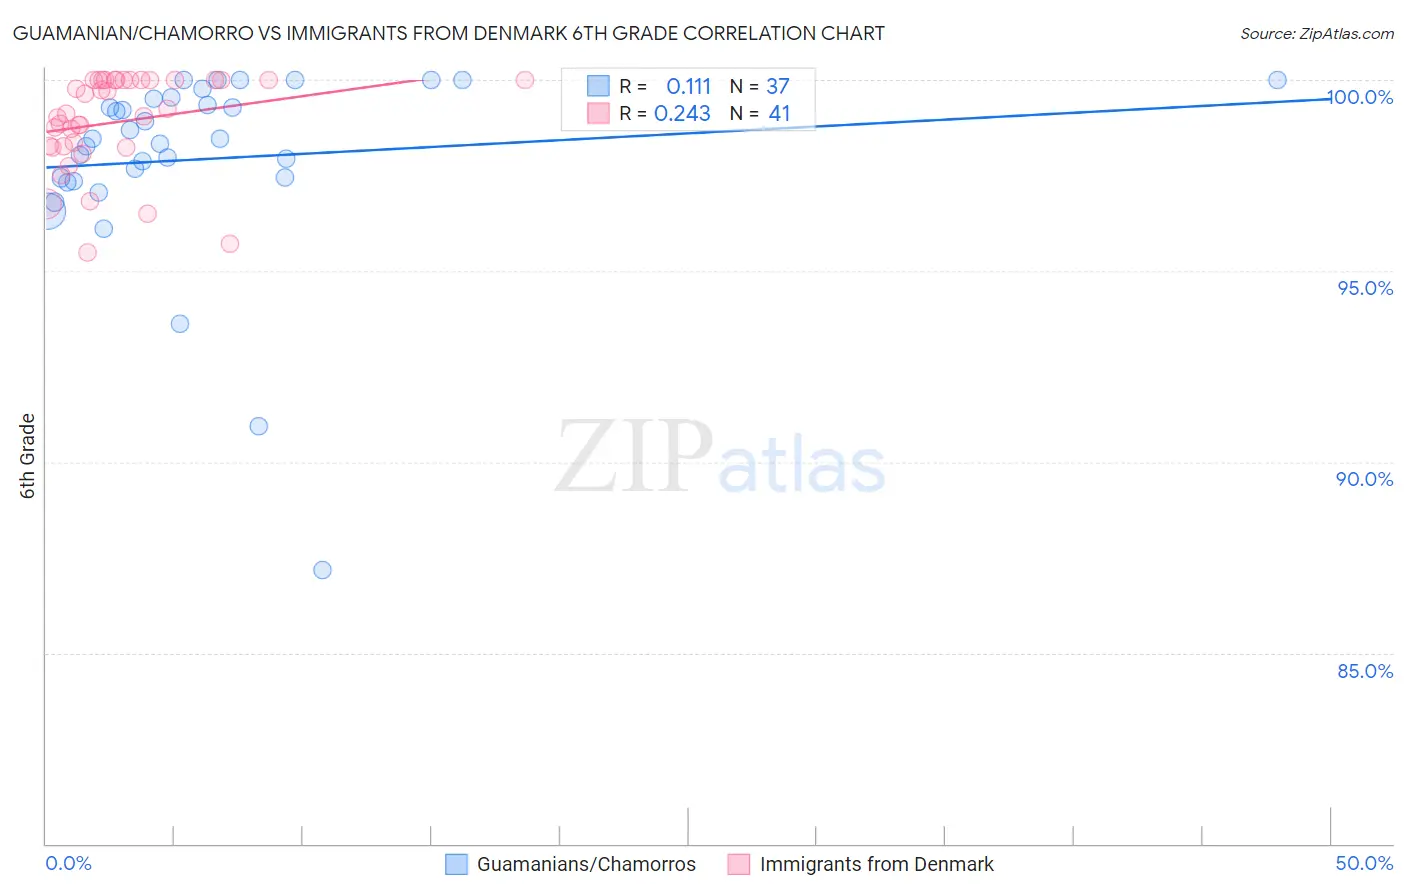
Guamanian/Chamorro vs Immigrants from Denmark 6th Grade Correlation Chart
The statistical analysis conducted on geographies consisting of 221,965,618 people shows a poor positive correlation between the proportion of Guamanians/Chamorros and percentage of population with at least 6th grade education in the United States with a correlation coefficient (R) of 0.111 and weighted average of 97.0%. Similarly, the statistical analysis conducted on geographies consisting of 136,430,932 people shows a weak positive correlation between the proportion of Immigrants from Denmark and percentage of population with at least 6th grade education in the United States with a correlation coefficient (R) of 0.243 and weighted average of 97.5%, a difference of 0.58%.
6th Grade Correlation Summary
| Measurement | Guamanian/Chamorro | Immigrants from Denmark |
| Minimum | 87.2% | 95.5% |
| Maximum | 100.0% | 100.0% |
| Range | 12.8% | 4.5% |
| Mean | 97.9% | 98.9% |
| Median | 98.5% | 99.1% |
| Interquartile 25% (IQ1) | 97.4% | 98.3% |
| Interquartile 75% (IQ3) | 99.5% | 100.0% |
| Interquartile Range (IQR) | 2.1% | 1.7% |
| Standard Deviation (Sample) | 2.6% | 1.3% |
| Standard Deviation (Population) | 2.6% | 1.2% |
Similar Demographics by 6th Grade
Demographics Similar to Guamanians/Chamorros by 6th Grade
In terms of 6th grade, the demographic groups most similar to Guamanians/Chamorros are Immigrants from Egypt (97.0%, a difference of 0.0%), Immigrants from Argentina (97.0%, a difference of 0.0%), Black/African American (97.0%, a difference of 0.0%), Argentinean (97.0%, a difference of 0.010%), and Dutch West Indian (96.9%, a difference of 0.010%).
| Demographics | Rating | Rank | 6th Grade |
| Immigrants | Spain | 39.9 /100 | #180 | Fair 97.0% |
| Comanche | 37.9 /100 | #181 | Fair 97.0% |
| Immigrants | Ukraine | 35.6 /100 | #182 | Fair 97.0% |
| Immigrants | Venezuela | 34.5 /100 | #183 | Fair 97.0% |
| Spanish Americans | 33.5 /100 | #184 | Fair 97.0% |
| Argentineans | 33.0 /100 | #185 | Fair 97.0% |
| Immigrants | Egypt | 31.4 /100 | #186 | Fair 97.0% |
| Guamanians/Chamorros | 30.6 /100 | #187 | Fair 97.0% |
| Immigrants | Argentina | 30.4 /100 | #188 | Fair 97.0% |
| Blacks/African Americans | 30.2 /100 | #189 | Fair 97.0% |
| Dutch West Indians | 28.3 /100 | #190 | Fair 96.9% |
| Panamanians | 27.3 /100 | #191 | Fair 96.9% |
| Hawaiians | 27.0 /100 | #192 | Fair 96.9% |
| Paraguayans | 26.6 /100 | #193 | Fair 96.9% |
| Immigrants | Lebanon | 25.6 /100 | #194 | Fair 96.9% |
Demographics Similar to Immigrants from Denmark by 6th Grade
In terms of 6th grade, the demographic groups most similar to Immigrants from Denmark are Yugoslavian (97.5%, a difference of 0.0%), Romanian (97.5%, a difference of 0.010%), Cree (97.5%, a difference of 0.010%), Cypriot (97.5%, a difference of 0.010%), and Immigrants from Ireland (97.5%, a difference of 0.010%).
| Demographics | Rating | Rank | 6th Grade |
| Immigrants | Western Europe | 98.8 /100 | #91 | Exceptional 97.5% |
| Romanians | 98.7 /100 | #92 | Exceptional 97.5% |
| Cree | 98.7 /100 | #93 | Exceptional 97.5% |
| Cypriots | 98.7 /100 | #94 | Exceptional 97.5% |
| Immigrants | Ireland | 98.7 /100 | #95 | Exceptional 97.5% |
| Immigrants | Germany | 98.6 /100 | #96 | Exceptional 97.5% |
| Immigrants | Sweden | 98.6 /100 | #97 | Exceptional 97.5% |
| Immigrants | Denmark | 98.5 /100 | #98 | Exceptional 97.5% |
| Yugoslavians | 98.5 /100 | #99 | Exceptional 97.5% |
| Turks | 98.3 /100 | #100 | Exceptional 97.5% |
| South Africans | 98.2 /100 | #101 | Exceptional 97.5% |
| Choctaw | 98.0 /100 | #102 | Exceptional 97.5% |
| Bhutanese | 98.0 /100 | #103 | Exceptional 97.5% |
| German Russians | 97.9 /100 | #104 | Exceptional 97.5% |
| Cheyenne | 97.9 /100 | #105 | Exceptional 97.5% |