Asian vs Immigrants from Denmark Disability Age 35 to 64
COMPARE
Asian
Immigrants from Denmark
Disability Age 35 to 64
Disability Age 35 to 64 Comparison
Asians
Immigrants from Denmark
9.4%
DISABILITY AGE 35 TO 64
100.0/ 100
METRIC RATING
24th/ 347
METRIC RANK
10.3%
DISABILITY AGE 35 TO 64
98.4/ 100
METRIC RATING
97th/ 347
METRIC RANK
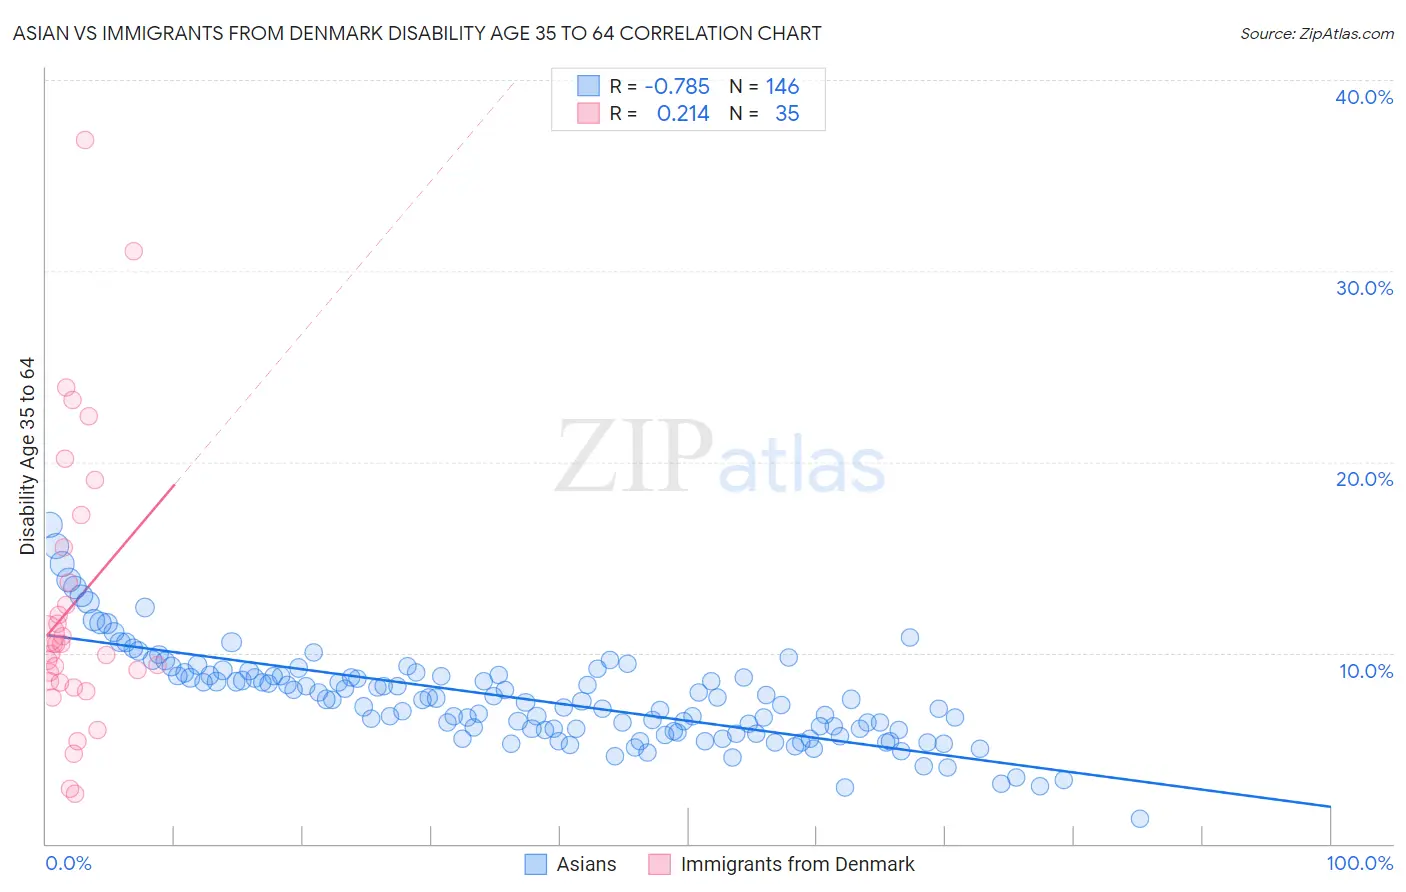
Asian vs Immigrants from Denmark Disability Age 35 to 64 Correlation Chart
The statistical analysis conducted on geographies consisting of 549,994,664 people shows a strong negative correlation between the proportion of Asians and percentage of population with a disability between the ages 34 and 64 in the United States with a correlation coefficient (R) of -0.785 and weighted average of 9.4%. Similarly, the statistical analysis conducted on geographies consisting of 136,399,162 people shows a weak positive correlation between the proportion of Immigrants from Denmark and percentage of population with a disability between the ages 34 and 64 in the United States with a correlation coefficient (R) of 0.214 and weighted average of 10.3%, a difference of 10.2%.
Disability Age 35 to 64 Correlation Summary
| Measurement | Asian | Immigrants from Denmark |
| Minimum | 1.3% | 2.6% |
| Maximum | 16.7% | 36.8% |
| Range | 15.4% | 34.2% |
| Mean | 7.6% | 12.6% |
| Median | 7.5% | 10.5% |
| Interquartile 25% (IQ1) | 5.9% | 8.4% |
| Interquartile 75% (IQ3) | 8.8% | 15.5% |
| Interquartile Range (IQR) | 2.9% | 7.1% |
| Standard Deviation (Sample) | 2.5% | 7.5% |
| Standard Deviation (Population) | 2.5% | 7.4% |
Similar Demographics by Disability Age 35 to 64
Demographics Similar to Asians by Disability Age 35 to 64
In terms of disability age 35 to 64, the demographic groups most similar to Asians are Argentinean (9.4%, a difference of 0.010%), Cypriot (9.4%, a difference of 0.23%), Okinawan (9.4%, a difference of 0.26%), Venezuelan (9.4%, a difference of 0.29%), and Immigrants from Argentina (9.3%, a difference of 0.69%).
| Demographics | Rating | Rank | Disability Age 35 to 64 |
| Burmese | 100.0 /100 | #17 | Exceptional 9.2% |
| Soviet Union | 100.0 /100 | #18 | Exceptional 9.2% |
| Immigrants | Venezuela | 100.0 /100 | #19 | Exceptional 9.3% |
| Immigrants | Argentina | 100.0 /100 | #20 | Exceptional 9.3% |
| Okinawans | 100.0 /100 | #21 | Exceptional 9.4% |
| Cypriots | 100.0 /100 | #22 | Exceptional 9.4% |
| Argentineans | 100.0 /100 | #23 | Exceptional 9.4% |
| Asians | 100.0 /100 | #24 | Exceptional 9.4% |
| Venezuelans | 100.0 /100 | #25 | Exceptional 9.4% |
| Immigrants | Sri Lanka | 100.0 /100 | #26 | Exceptional 9.5% |
| Immigrants | Asia | 100.0 /100 | #27 | Exceptional 9.5% |
| Immigrants | Pakistan | 100.0 /100 | #28 | Exceptional 9.5% |
| Immigrants | Ireland | 100.0 /100 | #29 | Exceptional 9.5% |
| Immigrants | Japan | 100.0 /100 | #30 | Exceptional 9.5% |
| Immigrants | Lithuania | 99.9 /100 | #31 | Exceptional 9.6% |
Demographics Similar to Immigrants from Denmark by Disability Age 35 to 64
In terms of disability age 35 to 64, the demographic groups most similar to Immigrants from Denmark are Immigrants from Uruguay (10.3%, a difference of 0.070%), Immigrants from South Africa (10.3%, a difference of 0.18%), Palestinian (10.4%, a difference of 0.20%), Immigrants from Italy (10.3%, a difference of 0.42%), and Chinese (10.3%, a difference of 0.42%).
| Demographics | Rating | Rank | Disability Age 35 to 64 |
| Afghans | 98.9 /100 | #90 | Exceptional 10.3% |
| Immigrants | Lebanon | 98.9 /100 | #91 | Exceptional 10.3% |
| Immigrants | Northern Africa | 98.7 /100 | #92 | Exceptional 10.3% |
| Immigrants | North Macedonia | 98.7 /100 | #93 | Exceptional 10.3% |
| Immigrants | Italy | 98.7 /100 | #94 | Exceptional 10.3% |
| Chinese | 98.7 /100 | #95 | Exceptional 10.3% |
| Immigrants | South Africa | 98.5 /100 | #96 | Exceptional 10.3% |
| Immigrants | Denmark | 98.4 /100 | #97 | Exceptional 10.3% |
| Immigrants | Uruguay | 98.3 /100 | #98 | Exceptional 10.3% |
| Palestinians | 98.2 /100 | #99 | Exceptional 10.4% |
| Immigrants | Jordan | 98.1 /100 | #100 | Exceptional 10.4% |
| Immigrants | Philippines | 98.0 /100 | #101 | Exceptional 10.4% |
| Immigrants | Western Asia | 98.0 /100 | #102 | Exceptional 10.4% |
| Immigrants | Ukraine | 97.9 /100 | #103 | Exceptional 10.4% |
| Immigrants | Austria | 97.8 /100 | #104 | Exceptional 10.4% |