Immigrants from Peru vs Fijian Disability Age 35 to 64
COMPARE
Immigrants from Peru
Fijian
Disability Age 35 to 64
Disability Age 35 to 64 Comparison
Immigrants from Peru
Fijians
9.8%
DISABILITY AGE 35 TO 64
99.9/ 100
METRIC RATING
45th/ 347
METRIC RANK
13.2%
DISABILITY AGE 35 TO 64
0.0/ 100
METRIC RATING
288th/ 347
METRIC RANK
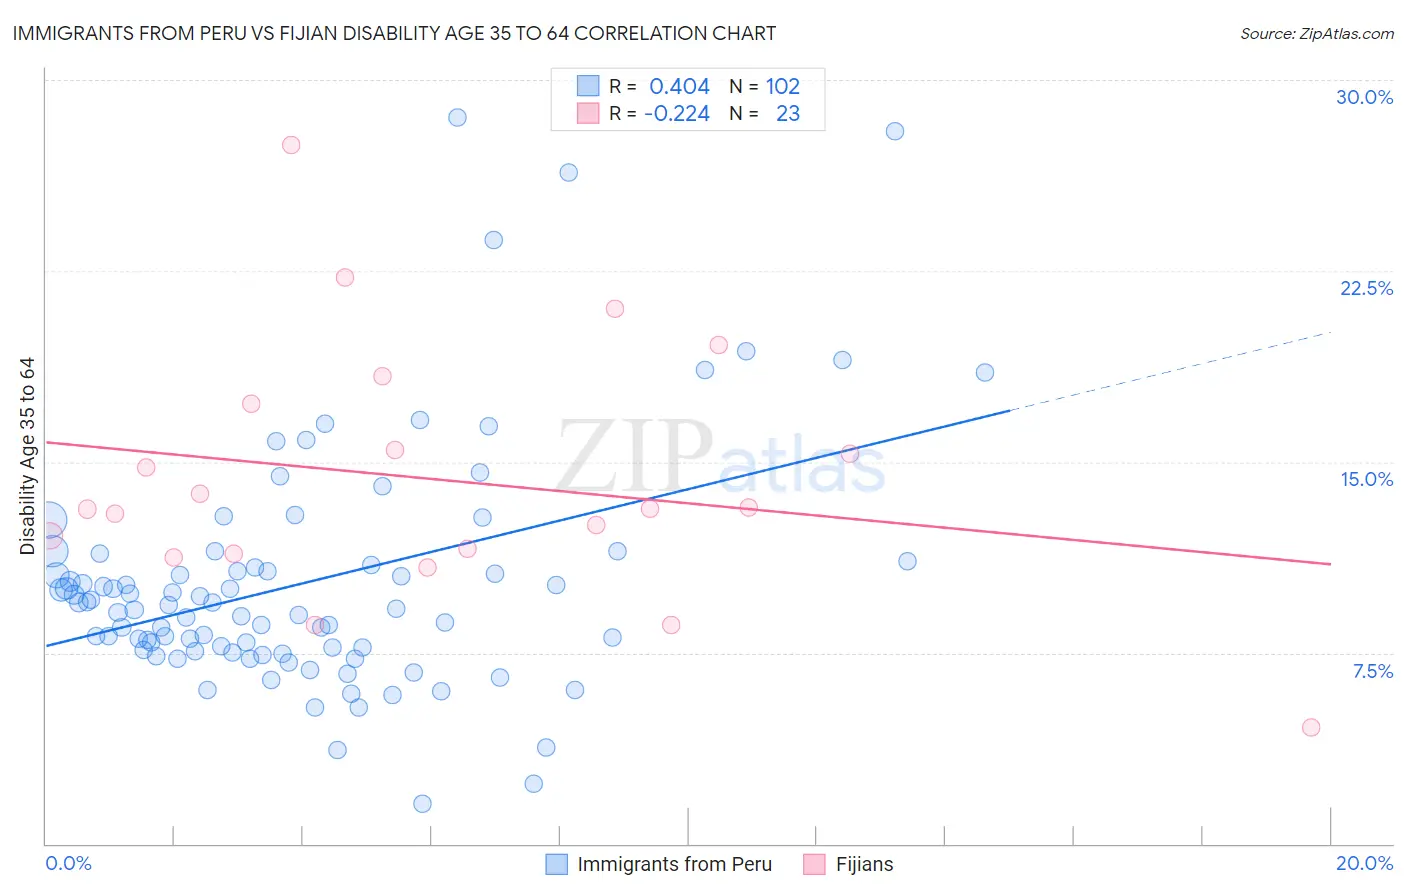
Immigrants from Peru vs Fijian Disability Age 35 to 64 Correlation Chart
The statistical analysis conducted on geographies consisting of 328,733,403 people shows a moderate positive correlation between the proportion of Immigrants from Peru and percentage of population with a disability between the ages 34 and 64 in the United States with a correlation coefficient (R) of 0.404 and weighted average of 9.8%. Similarly, the statistical analysis conducted on geographies consisting of 55,946,690 people shows a weak negative correlation between the proportion of Fijians and percentage of population with a disability between the ages 34 and 64 in the United States with a correlation coefficient (R) of -0.224 and weighted average of 13.2%, a difference of 35.0%.
Disability Age 35 to 64 Correlation Summary
| Measurement | Immigrants from Peru | Fijian |
| Minimum | 1.6% | 4.5% |
| Maximum | 28.5% | 27.5% |
| Range | 27.0% | 22.9% |
| Mean | 10.3% | 14.3% |
| Median | 9.3% | 13.2% |
| Interquartile 25% (IQ1) | 7.6% | 11.4% |
| Interquartile 75% (IQ3) | 11.0% | 17.3% |
| Interquartile Range (IQR) | 3.4% | 5.9% |
| Standard Deviation (Sample) | 4.7% | 5.0% |
| Standard Deviation (Population) | 4.7% | 4.9% |
Similar Demographics by Disability Age 35 to 64
Demographics Similar to Immigrants from Peru by Disability Age 35 to 64
In terms of disability age 35 to 64, the demographic groups most similar to Immigrants from Peru are Immigrants from Egypt (9.8%, a difference of 0.060%), Cambodian (9.8%, a difference of 0.18%), Immigrants from Belgium (9.8%, a difference of 0.24%), Immigrants from Serbia (9.8%, a difference of 0.25%), and Immigrants from Greece (9.8%, a difference of 0.29%).
| Demographics | Rating | Rank | Disability Age 35 to 64 |
| Egyptians | 99.9 /100 | #38 | Exceptional 9.7% |
| Immigrants | Belarus | 99.9 /100 | #39 | Exceptional 9.7% |
| Immigrants | Armenia | 99.9 /100 | #40 | Exceptional 9.7% |
| Israelis | 99.9 /100 | #41 | Exceptional 9.7% |
| Immigrants | Malaysia | 99.9 /100 | #42 | Exceptional 9.7% |
| Immigrants | Colombia | 99.9 /100 | #43 | Exceptional 9.8% |
| Immigrants | Egypt | 99.9 /100 | #44 | Exceptional 9.8% |
| Immigrants | Peru | 99.9 /100 | #45 | Exceptional 9.8% |
| Cambodians | 99.8 /100 | #46 | Exceptional 9.8% |
| Immigrants | Belgium | 99.8 /100 | #47 | Exceptional 9.8% |
| Immigrants | Serbia | 99.8 /100 | #48 | Exceptional 9.8% |
| Immigrants | Greece | 99.8 /100 | #49 | Exceptional 9.8% |
| Paraguayans | 99.8 /100 | #50 | Exceptional 9.8% |
| Bhutanese | 99.8 /100 | #51 | Exceptional 9.8% |
| Immigrants | Bulgaria | 99.8 /100 | #52 | Exceptional 9.8% |
Demographics Similar to Fijians by Disability Age 35 to 64
In terms of disability age 35 to 64, the demographic groups most similar to Fijians are Indonesian (13.2%, a difference of 0.070%), Immigrants from Liberia (13.2%, a difference of 0.15%), Tlingit-Haida (13.2%, a difference of 0.35%), Hmong (13.1%, a difference of 0.62%), and Immigrants from Congo (13.3%, a difference of 0.66%).
| Demographics | Rating | Rank | Disability Age 35 to 64 |
| Scotch-Irish | 0.1 /100 | #281 | Tragic 13.0% |
| Immigrants | Laos | 0.1 /100 | #282 | Tragic 13.0% |
| Central American Indians | 0.0 /100 | #283 | Tragic 13.0% |
| Immigrants | Nonimmigrants | 0.0 /100 | #284 | Tragic 13.0% |
| Immigrants | Somalia | 0.0 /100 | #285 | Tragic 13.1% |
| Hmong | 0.0 /100 | #286 | Tragic 13.1% |
| Tlingit-Haida | 0.0 /100 | #287 | Tragic 13.2% |
| Fijians | 0.0 /100 | #288 | Tragic 13.2% |
| Indonesians | 0.0 /100 | #289 | Tragic 13.2% |
| Immigrants | Liberia | 0.0 /100 | #290 | Tragic 13.2% |
| Immigrants | Congo | 0.0 /100 | #291 | Tragic 13.3% |
| Puget Sound Salish | 0.0 /100 | #292 | Tragic 13.3% |
| Ute | 0.0 /100 | #293 | Tragic 13.4% |
| Yaqui | 0.0 /100 | #294 | Tragic 13.5% |
| Yakama | 0.0 /100 | #295 | Tragic 13.6% |