Guamanian/Chamorro vs Fijian Child Poverty Among Girls Under 16
COMPARE
Guamanian/Chamorro
Fijian
Child Poverty Among Girls Under 16
Child Poverty Among Girls Under 16 Comparison
Guamanians/Chamorros
Fijians
15.9%
CHILD POVERTY AMONG GIRLS UNDER 16
75.3/ 100
METRIC RATING
158th/ 347
METRIC RANK
18.6%
CHILD POVERTY AMONG GIRLS UNDER 16
1.1/ 100
METRIC RATING
234th/ 347
METRIC RANK
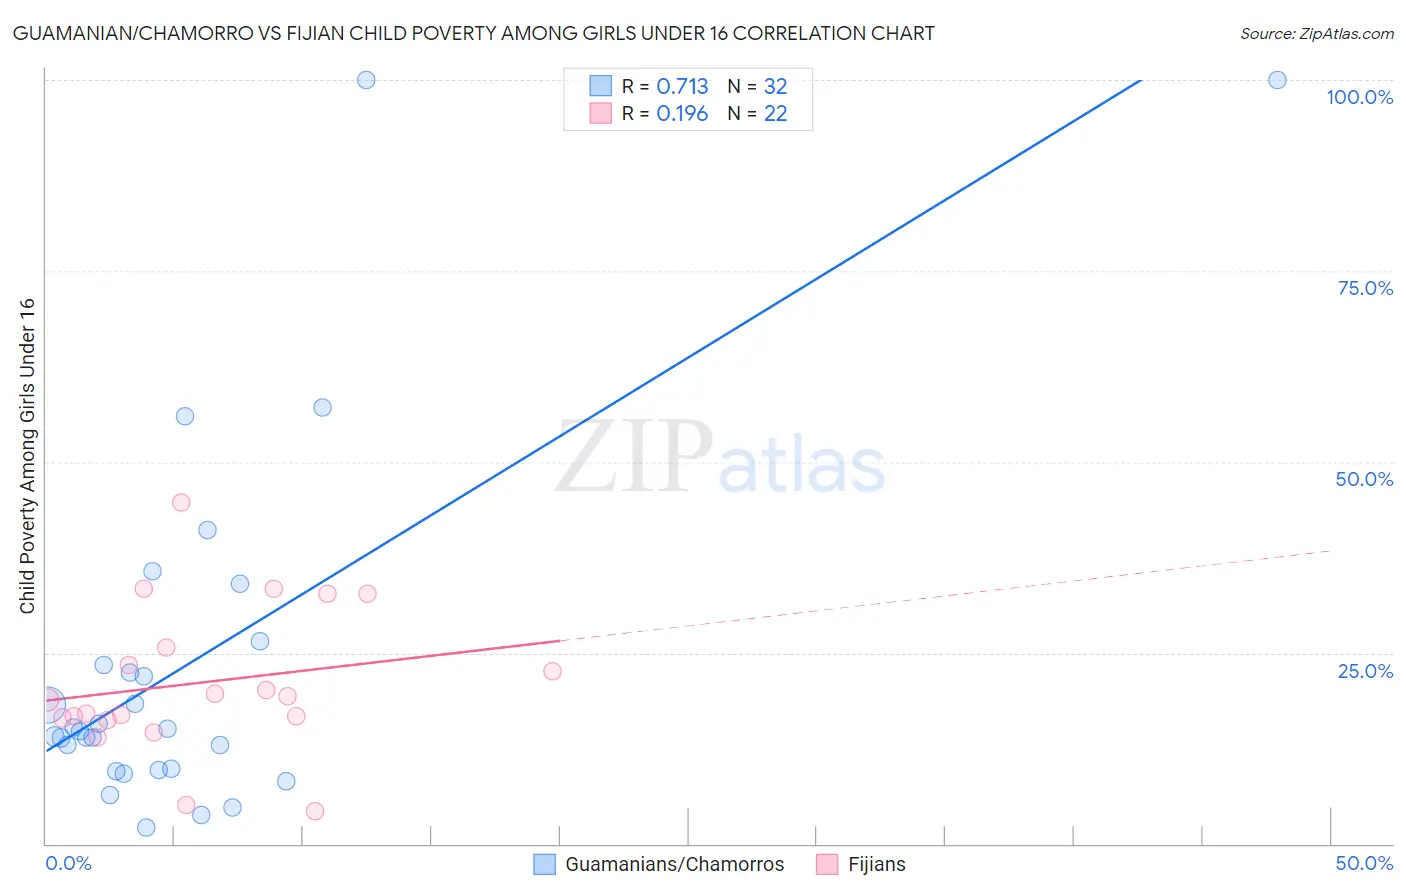
Guamanian/Chamorro vs Fijian Child Poverty Among Girls Under 16 Correlation Chart
The statistical analysis conducted on geographies consisting of 220,387,643 people shows a strong positive correlation between the proportion of Guamanians/Chamorros and poverty level among girls under the age of 16 in the United States with a correlation coefficient (R) of 0.713 and weighted average of 15.9%. Similarly, the statistical analysis conducted on geographies consisting of 55,823,808 people shows a poor positive correlation between the proportion of Fijians and poverty level among girls under the age of 16 in the United States with a correlation coefficient (R) of 0.196 and weighted average of 18.6%, a difference of 16.7%.
Child Poverty Among Girls Under 16 Correlation Summary
| Measurement | Guamanian/Chamorro | Fijian |
| Minimum | 2.0% | 4.3% |
| Maximum | 100.0% | 44.7% |
| Range | 98.0% | 40.5% |
| Mean | 23.8% | 21.1% |
| Median | 14.9% | 19.1% |
| Interquartile 25% (IQ1) | 9.7% | 16.5% |
| Interquartile 75% (IQ3) | 24.9% | 25.7% |
| Interquartile Range (IQR) | 15.2% | 9.2% |
| Standard Deviation (Sample) | 24.0% | 9.6% |
| Standard Deviation (Population) | 23.7% | 9.4% |
Similar Demographics by Child Poverty Among Girls Under 16
Demographics Similar to Guamanians/Chamorros by Child Poverty Among Girls Under 16
In terms of child poverty among girls under 16, the demographic groups most similar to Guamanians/Chamorros are Slovak (15.9%, a difference of 0.010%), Immigrants from Fiji (15.9%, a difference of 0.12%), Colombian (15.9%, a difference of 0.12%), Syrian (15.9%, a difference of 0.22%), and Immigrants from Chile (15.9%, a difference of 0.23%).
| Demographics | Rating | Rank | Child Poverty Among Girls Under 16 |
| Venezuelans | 80.1 /100 | #151 | Excellent 15.8% |
| Immigrants | Kuwait | 79.4 /100 | #152 | Good 15.8% |
| Immigrants | Nepal | 78.5 /100 | #153 | Good 15.9% |
| Immigrants | Chile | 76.7 /100 | #154 | Good 15.9% |
| Syrians | 76.7 /100 | #155 | Good 15.9% |
| Immigrants | Fiji | 76.1 /100 | #156 | Good 15.9% |
| Colombians | 76.1 /100 | #157 | Good 15.9% |
| Guamanians/Chamorros | 75.3 /100 | #158 | Good 15.9% |
| Slovaks | 75.2 /100 | #159 | Good 15.9% |
| French | 72.8 /100 | #160 | Good 16.0% |
| Immigrants | Northern Africa | 72.0 /100 | #161 | Good 16.0% |
| French Canadians | 68.7 /100 | #162 | Good 16.1% |
| Immigrants | Oceania | 68.4 /100 | #163 | Good 16.1% |
| Immigrants | Colombia | 67.8 /100 | #164 | Good 16.1% |
| Immigrants | Germany | 67.3 /100 | #165 | Good 16.1% |
Demographics Similar to Fijians by Child Poverty Among Girls Under 16
In terms of child poverty among girls under 16, the demographic groups most similar to Fijians are Nepalese (18.6%, a difference of 0.050%), Alsatian (18.6%, a difference of 0.060%), Sudanese (18.6%, a difference of 0.070%), Immigrants from Sudan (18.6%, a difference of 0.11%), and Immigrants from Nigeria (18.6%, a difference of 0.19%).
| Demographics | Rating | Rank | Child Poverty Among Girls Under 16 |
| Immigrants | Nonimmigrants | 2.0 /100 | #227 | Tragic 18.3% |
| Alaskan Athabascans | 2.0 /100 | #228 | Tragic 18.3% |
| Ghanaians | 1.4 /100 | #229 | Tragic 18.5% |
| Osage | 1.3 /100 | #230 | Tragic 18.5% |
| Cree | 1.3 /100 | #231 | Tragic 18.5% |
| Immigrants | Sudan | 1.1 /100 | #232 | Tragic 18.6% |
| Sudanese | 1.1 /100 | #233 | Tragic 18.6% |
| Fijians | 1.1 /100 | #234 | Tragic 18.6% |
| Nepalese | 1.1 /100 | #235 | Tragic 18.6% |
| Alsatians | 1.1 /100 | #236 | Tragic 18.6% |
| Immigrants | Nigeria | 1.0 /100 | #237 | Tragic 18.6% |
| Immigrants | Eritrea | 1.0 /100 | #238 | Tragic 18.7% |
| Marshallese | 0.9 /100 | #239 | Tragic 18.7% |
| Nigerians | 0.9 /100 | #240 | Tragic 18.7% |
| Americans | 0.8 /100 | #241 | Tragic 18.8% |