Greek vs Macedonian Female Poverty Among 18-24 Year Olds
COMPARE
Greek
Macedonian
Female Poverty Among 18-24 Year Olds
Female Poverty Among 18-24 Year Olds Comparison
Greeks
Macedonians
18.5%
FEMALE POVERTY AMONG 18-24 YEAR OLDS
99.8/ 100
METRIC RATING
62nd/ 347
METRIC RANK
18.1%
FEMALE POVERTY AMONG 18-24 YEAR OLDS
100.0/ 100
METRIC RATING
43rd/ 347
METRIC RANK
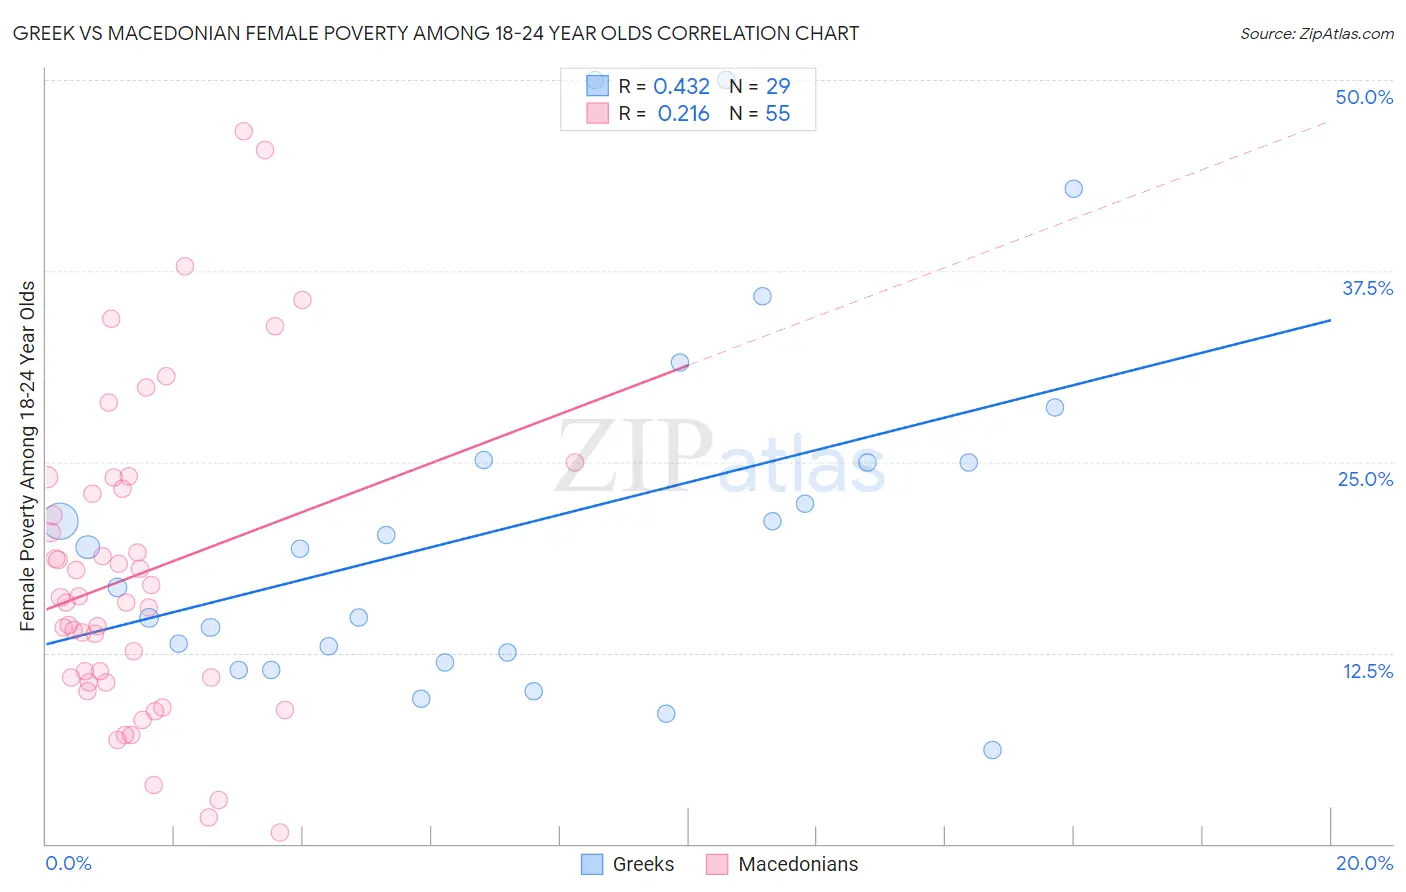
Greek vs Macedonian Female Poverty Among 18-24 Year Olds Correlation Chart
The statistical analysis conducted on geographies consisting of 463,009,095 people shows a moderate positive correlation between the proportion of Greeks and poverty level among females between the ages 18 and 24 in the United States with a correlation coefficient (R) of 0.432 and weighted average of 18.5%. Similarly, the statistical analysis conducted on geographies consisting of 130,973,657 people shows a weak positive correlation between the proportion of Macedonians and poverty level among females between the ages 18 and 24 in the United States with a correlation coefficient (R) of 0.216 and weighted average of 18.1%, a difference of 2.5%.
Female Poverty Among 18-24 Year Olds Correlation Summary
| Measurement | Greek | Macedonian |
| Minimum | 6.1% | 0.76% |
| Maximum | 50.0% | 46.6% |
| Range | 43.9% | 45.9% |
| Mean | 20.9% | 17.6% |
| Median | 19.3% | 15.8% |
| Interquartile 25% (IQ1) | 12.2% | 10.6% |
| Interquartile 75% (IQ3) | 25.1% | 23.3% |
| Interquartile Range (IQR) | 12.9% | 12.7% |
| Standard Deviation (Sample) | 11.7% | 10.2% |
| Standard Deviation (Population) | 11.5% | 10.1% |
Demographics Similar to Greeks and Macedonians by Female Poverty Among 18-24 Year Olds
In terms of female poverty among 18-24 year olds, the demographic groups most similar to Greeks are Immigrants from Albania (18.5%, a difference of 0.070%), Immigrants from Brazil (18.5%, a difference of 0.12%), Egyptian (18.5%, a difference of 0.48%), Immigrants from Ukraine (18.4%, a difference of 0.77%), and Immigrants from Italy (18.4%, a difference of 0.83%). Similarly, the demographic groups most similar to Macedonians are Bulgarian (18.1%, a difference of 0.010%), Nicaraguan (18.1%, a difference of 0.080%), Spanish American Indian (18.1%, a difference of 0.17%), Immigrants from Southern Europe (18.2%, a difference of 0.45%), and Asian (18.2%, a difference of 0.54%).
| Demographics | Rating | Rank | Female Poverty Among 18-24 Year Olds |
| Bulgarians | 100.0 /100 | #42 | Exceptional 18.1% |
| Macedonians | 100.0 /100 | #43 | Exceptional 18.1% |
| Nicaraguans | 100.0 /100 | #44 | Exceptional 18.1% |
| Spanish American Indians | 100.0 /100 | #45 | Exceptional 18.1% |
| Immigrants | Southern Europe | 100.0 /100 | #46 | Exceptional 18.2% |
| Asians | 100.0 /100 | #47 | Exceptional 18.2% |
| Sri Lankans | 100.0 /100 | #48 | Exceptional 18.2% |
| Bhutanese | 100.0 /100 | #49 | Exceptional 18.2% |
| Samoans | 100.0 /100 | #50 | Exceptional 18.2% |
| Immigrants | Eastern Europe | 99.9 /100 | #51 | Exceptional 18.2% |
| Immigrants | Ireland | 99.9 /100 | #52 | Exceptional 18.3% |
| Italians | 99.9 /100 | #53 | Exceptional 18.3% |
| Immigrants | Egypt | 99.9 /100 | #54 | Exceptional 18.4% |
| Albanians | 99.9 /100 | #55 | Exceptional 18.4% |
| Argentineans | 99.9 /100 | #56 | Exceptional 18.4% |
| Immigrants | Italy | 99.9 /100 | #57 | Exceptional 18.4% |
| Immigrants | Ukraine | 99.9 /100 | #58 | Exceptional 18.4% |
| Egyptians | 99.9 /100 | #59 | Exceptional 18.5% |
| Immigrants | Brazil | 99.8 /100 | #60 | Exceptional 18.5% |
| Immigrants | Albania | 99.8 /100 | #61 | Exceptional 18.5% |
| Greeks | 99.8 /100 | #62 | Exceptional 18.5% |