Greek vs Macedonian Child Poverty Among Girls Under 16
COMPARE
Greek
Macedonian
Child Poverty Among Girls Under 16
Child Poverty Among Girls Under 16 Comparison
Greeks
Macedonians
14.2%
CHILD POVERTY AMONG GIRLS UNDER 16
99.2/ 100
METRIC RATING
49th/ 347
METRIC RANK
14.7%
CHILD POVERTY AMONG GIRLS UNDER 16
97.6/ 100
METRIC RATING
82nd/ 347
METRIC RANK
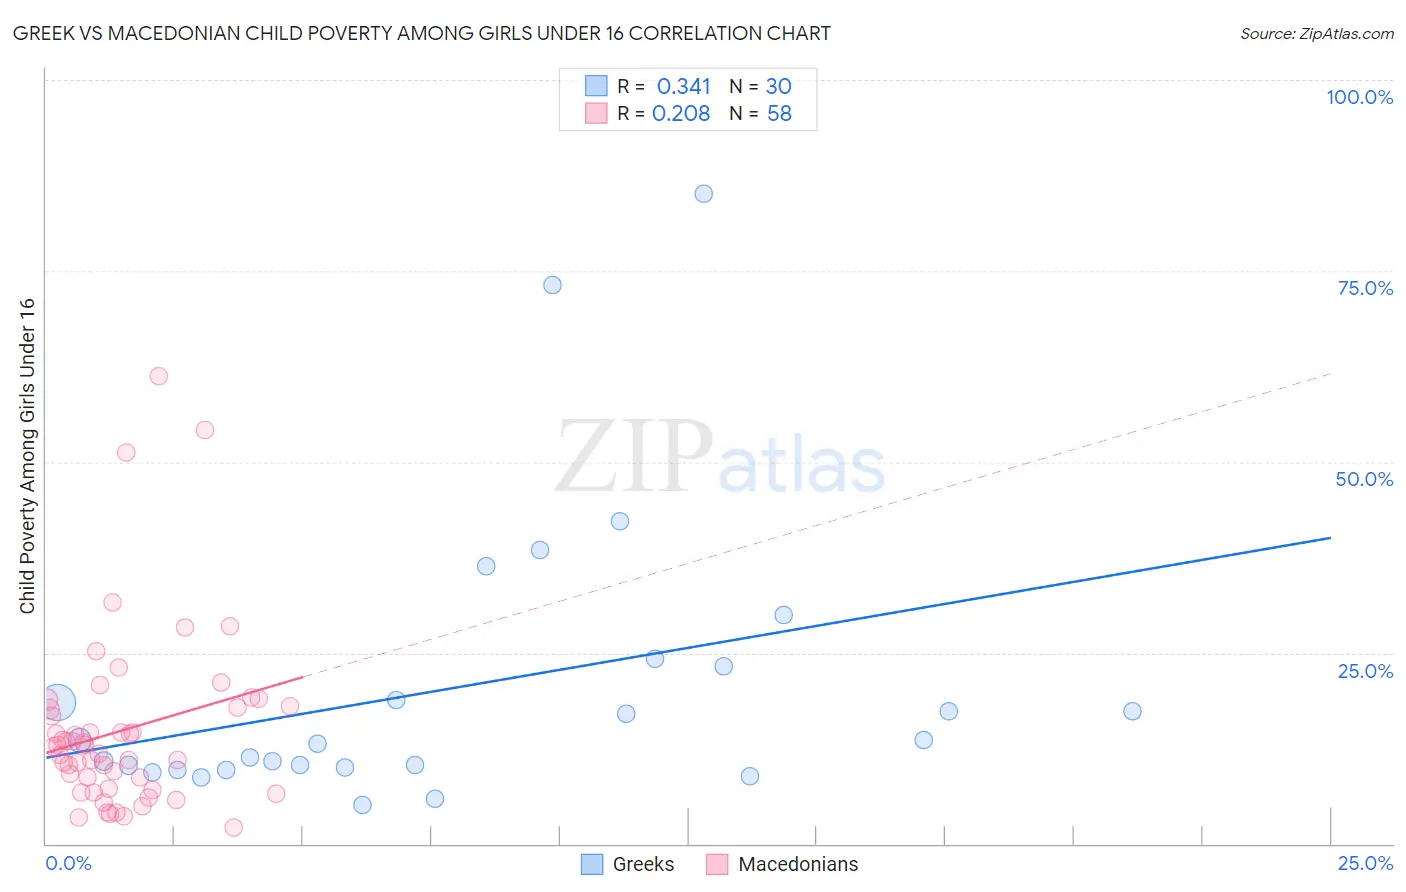
Greek vs Macedonian Child Poverty Among Girls Under 16 Correlation Chart
The statistical analysis conducted on geographies consisting of 468,807,341 people shows a mild positive correlation between the proportion of Greeks and poverty level among girls under the age of 16 in the United States with a correlation coefficient (R) of 0.341 and weighted average of 14.2%. Similarly, the statistical analysis conducted on geographies consisting of 131,236,838 people shows a weak positive correlation between the proportion of Macedonians and poverty level among girls under the age of 16 in the United States with a correlation coefficient (R) of 0.208 and weighted average of 14.7%, a difference of 4.0%.
Child Poverty Among Girls Under 16 Correlation Summary
| Measurement | Greek | Macedonian |
| Minimum | 5.0% | 2.1% |
| Maximum | 85.1% | 61.2% |
| Range | 80.1% | 59.1% |
| Mean | 20.4% | 14.9% |
| Median | 13.3% | 12.8% |
| Interquartile 25% (IQ1) | 10.0% | 7.2% |
| Interquartile 75% (IQ3) | 23.2% | 17.9% |
| Interquartile Range (IQR) | 13.2% | 10.7% |
| Standard Deviation (Sample) | 18.6% | 11.7% |
| Standard Deviation (Population) | 18.3% | 11.6% |
Similar Demographics by Child Poverty Among Girls Under 16
Demographics Similar to Greeks by Child Poverty Among Girls Under 16
In terms of child poverty among girls under 16, the demographic groups most similar to Greeks are Czech (14.2%, a difference of 0.040%), Immigrants from Czechoslovakia (14.2%, a difference of 0.060%), Immigrants from Israel (14.2%, a difference of 0.070%), Croatian (14.1%, a difference of 0.080%), and Immigrants from Greece (14.1%, a difference of 0.11%).
| Demographics | Rating | Rank | Child Poverty Among Girls Under 16 |
| Immigrants | Scotland | 99.4 /100 | #42 | Exceptional 14.0% |
| Koreans | 99.4 /100 | #43 | Exceptional 14.1% |
| Immigrants | Asia | 99.4 /100 | #44 | Exceptional 14.1% |
| Immigrants | Greece | 99.3 /100 | #45 | Exceptional 14.1% |
| Croatians | 99.3 /100 | #46 | Exceptional 14.1% |
| Immigrants | Czechoslovakia | 99.3 /100 | #47 | Exceptional 14.2% |
| Czechs | 99.3 /100 | #48 | Exceptional 14.2% |
| Greeks | 99.2 /100 | #49 | Exceptional 14.2% |
| Immigrants | Israel | 99.2 /100 | #50 | Exceptional 14.2% |
| Immigrants | Pakistan | 99.1 /100 | #51 | Exceptional 14.2% |
| Italians | 99.1 /100 | #52 | Exceptional 14.3% |
| Luxembourgers | 99.0 /100 | #53 | Exceptional 14.3% |
| Estonians | 98.9 /100 | #54 | Exceptional 14.3% |
| Immigrants | Romania | 98.9 /100 | #55 | Exceptional 14.3% |
| Immigrants | Indonesia | 98.9 /100 | #56 | Exceptional 14.4% |
Demographics Similar to Macedonians by Child Poverty Among Girls Under 16
In terms of child poverty among girls under 16, the demographic groups most similar to Macedonians are Ukrainian (14.7%, a difference of 0.24%), Immigrants from Italy (14.8%, a difference of 0.25%), Soviet Union (14.8%, a difference of 0.33%), Egyptian (14.7%, a difference of 0.43%), and Immigrants from Turkey (14.7%, a difference of 0.44%).
| Demographics | Rating | Rank | Child Poverty Among Girls Under 16 |
| Immigrants | Eastern Europe | 98.0 /100 | #75 | Exceptional 14.6% |
| Immigrants | Russia | 97.9 /100 | #76 | Exceptional 14.7% |
| Tlingit-Haida | 97.9 /100 | #77 | Exceptional 14.7% |
| Argentineans | 97.9 /100 | #78 | Exceptional 14.7% |
| Immigrants | Turkey | 97.9 /100 | #79 | Exceptional 14.7% |
| Egyptians | 97.9 /100 | #80 | Exceptional 14.7% |
| Ukrainians | 97.7 /100 | #81 | Exceptional 14.7% |
| Macedonians | 97.6 /100 | #82 | Exceptional 14.7% |
| Immigrants | Italy | 97.4 /100 | #83 | Exceptional 14.8% |
| Soviet Union | 97.3 /100 | #84 | Exceptional 14.8% |
| Swiss | 97.2 /100 | #85 | Exceptional 14.8% |
| Australians | 97.2 /100 | #86 | Exceptional 14.8% |
| Finns | 97.2 /100 | #87 | Exceptional 14.8% |
| Immigrants | Canada | 97.1 /100 | #88 | Exceptional 14.8% |
| Jordanians | 97.1 /100 | #89 | Exceptional 14.8% |