Somali vs Macedonian Cognitive Disability
COMPARE
Somali
Macedonian
Cognitive Disability
Cognitive Disability Comparison
Somalis
Macedonians
19.8%
COGNITIVE DISABILITY
0.0/ 100
METRIC RATING
345th/ 347
METRIC RANK
16.5%
COGNITIVE DISABILITY
99.8/ 100
METRIC RATING
44th/ 347
METRIC RANK
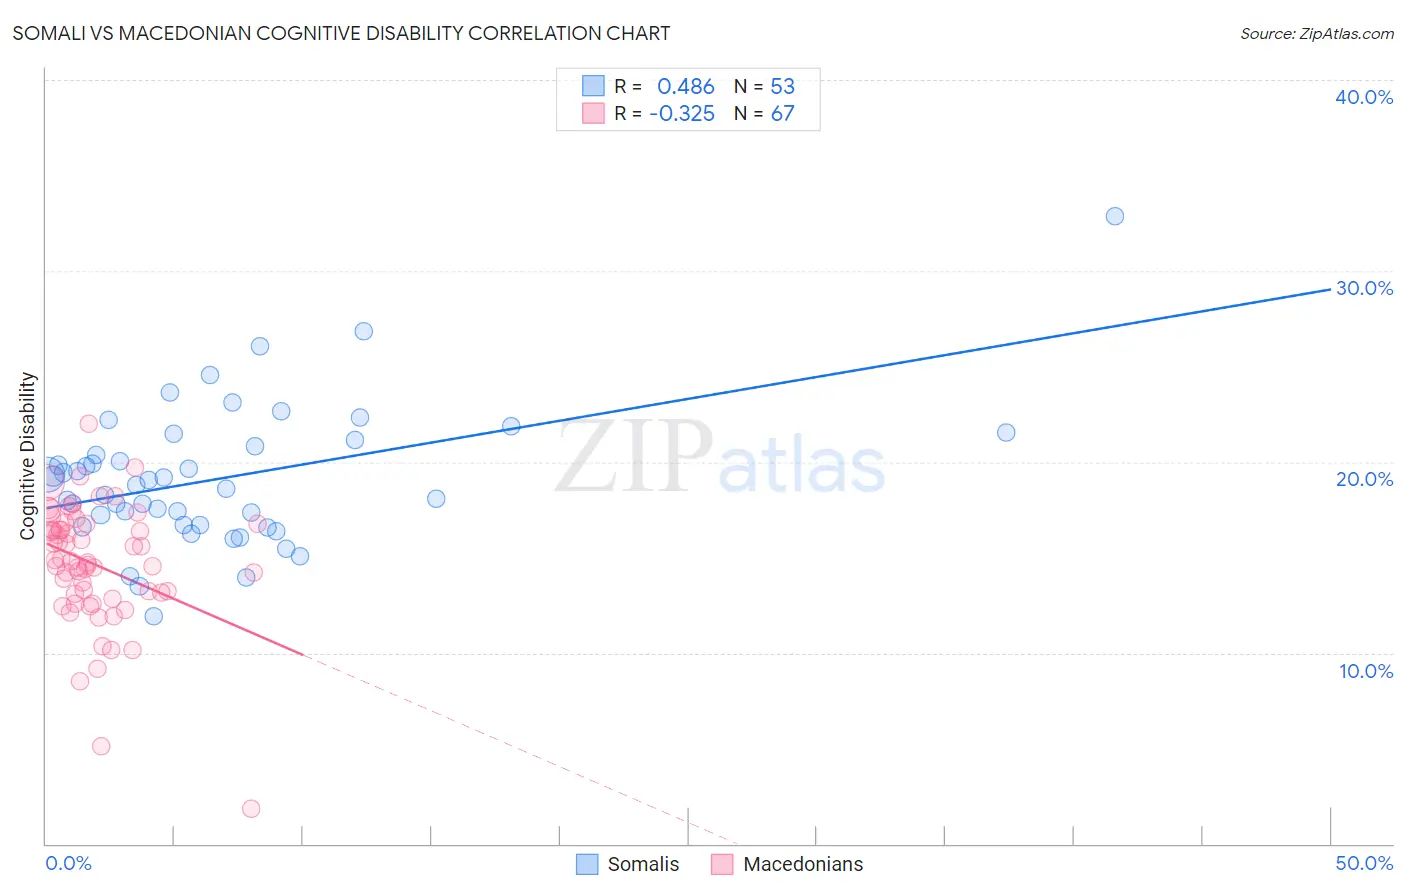
Somali vs Macedonian Cognitive Disability Correlation Chart
The statistical analysis conducted on geographies consisting of 99,318,466 people shows a moderate positive correlation between the proportion of Somalis and percentage of population with cognitive disability in the United States with a correlation coefficient (R) of 0.486 and weighted average of 19.8%. Similarly, the statistical analysis conducted on geographies consisting of 132,658,895 people shows a mild negative correlation between the proportion of Macedonians and percentage of population with cognitive disability in the United States with a correlation coefficient (R) of -0.325 and weighted average of 16.5%, a difference of 20.2%.
Cognitive Disability Correlation Summary
| Measurement | Somali | Macedonian |
| Minimum | 11.9% | 1.8% |
| Maximum | 32.8% | 22.0% |
| Range | 20.9% | 20.2% |
| Mean | 19.1% | 14.6% |
| Median | 18.8% | 14.8% |
| Interquartile 25% (IQ1) | 16.7% | 13.1% |
| Interquartile 75% (IQ3) | 21.0% | 16.8% |
| Interquartile Range (IQR) | 4.3% | 3.7% |
| Standard Deviation (Sample) | 3.6% | 3.2% |
| Standard Deviation (Population) | 3.6% | 3.2% |
Similar Demographics by Cognitive Disability
Demographics Similar to Somalis by Cognitive Disability
In terms of cognitive disability, the demographic groups most similar to Somalis are Immigrants from Cabo Verde (19.9%, a difference of 0.16%), Immigrants from Congo (19.7%, a difference of 0.56%), Immigrants from Somalia (20.0%, a difference of 0.89%), Immigrants from Zaire (19.4%, a difference of 2.2%), and Tohono O'odham (19.3%, a difference of 2.9%).
| Demographics | Rating | Rank | Cognitive Disability |
| Immigrants | Yemen | 0.0 /100 | #333 | Tragic 18.8% |
| Sudanese | 0.0 /100 | #334 | Tragic 18.9% |
| Senegalese | 0.0 /100 | #335 | Tragic 19.0% |
| Blacks/African Americans | 0.0 /100 | #336 | Tragic 19.0% |
| Immigrants | Saudi Arabia | 0.0 /100 | #337 | Tragic 19.1% |
| Lumbee | 0.0 /100 | #338 | Tragic 19.1% |
| Puerto Ricans | 0.0 /100 | #339 | Tragic 19.2% |
| Cape Verdeans | 0.0 /100 | #340 | Tragic 19.2% |
| Tohono O'odham | 0.0 /100 | #341 | Tragic 19.3% |
| Houma | 0.0 /100 | #342 | Tragic 19.3% |
| Immigrants | Zaire | 0.0 /100 | #343 | Tragic 19.4% |
| Immigrants | Congo | 0.0 /100 | #344 | Tragic 19.7% |
| Somalis | 0.0 /100 | #345 | Tragic 19.8% |
| Immigrants | Cabo Verde | 0.0 /100 | #346 | Tragic 19.9% |
| Immigrants | Somalia | 0.0 /100 | #347 | Tragic 20.0% |
Demographics Similar to Macedonians by Cognitive Disability
In terms of cognitive disability, the demographic groups most similar to Macedonians are Immigrants from Europe (16.5%, a difference of 0.010%), Immigrants from Colombia (16.5%, a difference of 0.020%), Immigrants from Canada (16.5%, a difference of 0.030%), Immigrants from Italy (16.5%, a difference of 0.050%), and Immigrants from North America (16.5%, a difference of 0.050%).
| Demographics | Rating | Rank | Cognitive Disability |
| Slovenes | 99.9 /100 | #37 | Exceptional 16.5% |
| Immigrants | Eastern Europe | 99.9 /100 | #38 | Exceptional 16.5% |
| Bolivians | 99.9 /100 | #39 | Exceptional 16.5% |
| Immigrants | Belarus | 99.9 /100 | #40 | Exceptional 16.5% |
| Cubans | 99.9 /100 | #41 | Exceptional 16.5% |
| Hungarians | 99.9 /100 | #42 | Exceptional 16.5% |
| Immigrants | Canada | 99.8 /100 | #43 | Exceptional 16.5% |
| Macedonians | 99.8 /100 | #44 | Exceptional 16.5% |
| Immigrants | Europe | 99.8 /100 | #45 | Exceptional 16.5% |
| Immigrants | Colombia | 99.8 /100 | #46 | Exceptional 16.5% |
| Immigrants | Italy | 99.8 /100 | #47 | Exceptional 16.5% |
| Immigrants | North America | 99.8 /100 | #48 | Exceptional 16.5% |
| Iranians | 99.8 /100 | #49 | Exceptional 16.5% |
| Norwegians | 99.8 /100 | #50 | Exceptional 16.5% |
| Immigrants | Korea | 99.8 /100 | #51 | Exceptional 16.5% |