Barbadian vs Immigrants from Western Africa Female Disability
COMPARE
Barbadian
Immigrants from Western Africa
Female Disability
Female Disability Comparison
Barbadians
Immigrants from Western Africa
12.6%
FEMALE DISABILITY
3.6/ 100
METRIC RATING
239th/ 347
METRIC RANK
12.3%
FEMALE DISABILITY
29.2/ 100
METRIC RATING
192nd/ 347
METRIC RANK
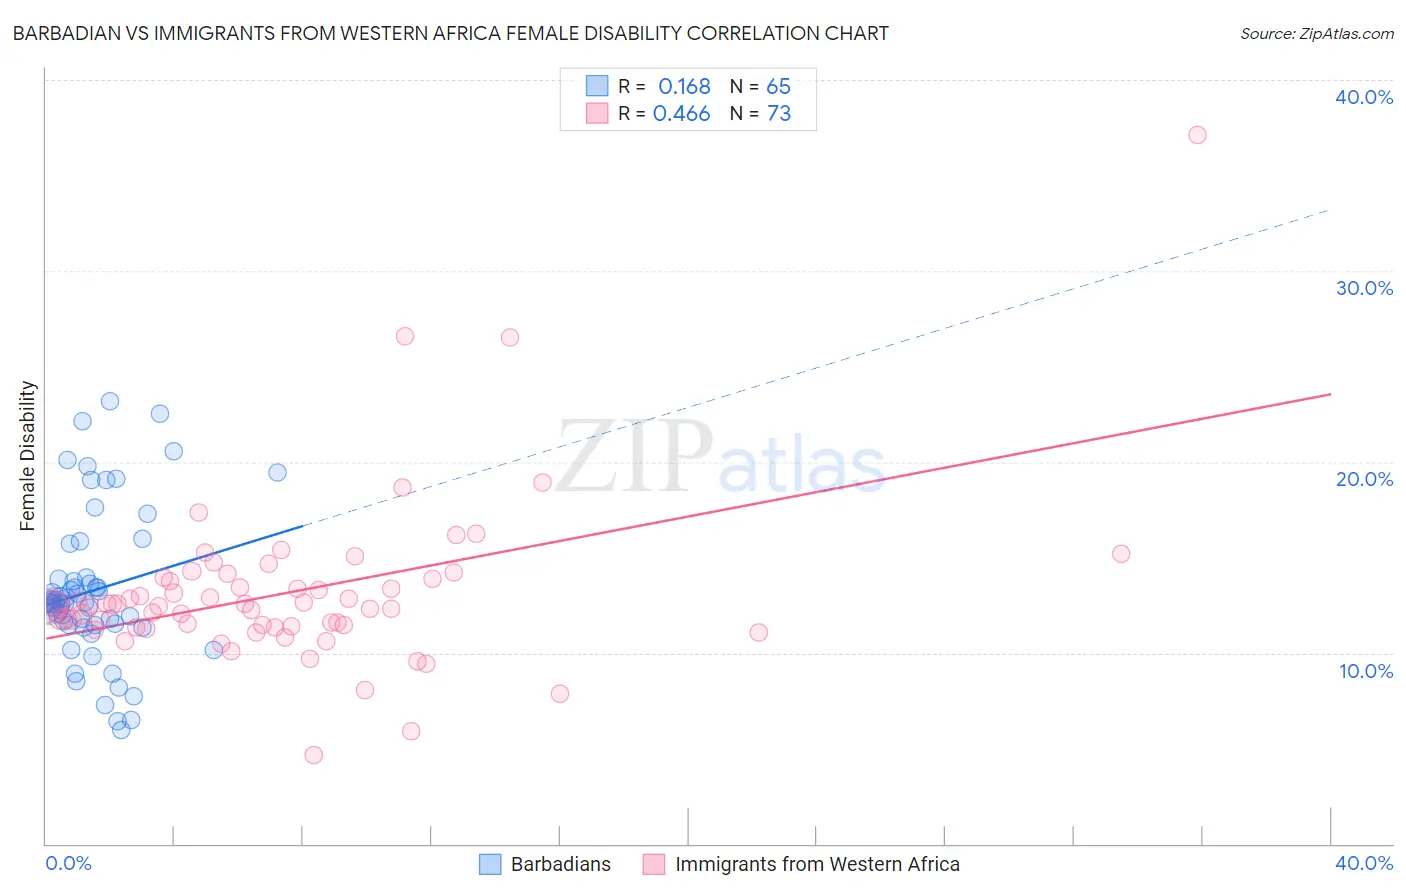
Barbadian vs Immigrants from Western Africa Female Disability Correlation Chart
The statistical analysis conducted on geographies consisting of 141,302,135 people shows a poor positive correlation between the proportion of Barbadians and percentage of females with a disability in the United States with a correlation coefficient (R) of 0.168 and weighted average of 12.6%. Similarly, the statistical analysis conducted on geographies consisting of 357,800,651 people shows a moderate positive correlation between the proportion of Immigrants from Western Africa and percentage of females with a disability in the United States with a correlation coefficient (R) of 0.466 and weighted average of 12.3%, a difference of 2.2%.
Female Disability Correlation Summary
| Measurement | Barbadian | Immigrants from Western Africa |
| Minimum | 5.9% | 4.6% |
| Maximum | 23.2% | 37.1% |
| Range | 17.2% | 32.5% |
| Mean | 13.3% | 13.1% |
| Median | 12.6% | 12.5% |
| Interquartile 25% (IQ1) | 11.5% | 11.3% |
| Interquartile 75% (IQ3) | 13.9% | 13.9% |
| Interquartile Range (IQR) | 2.4% | 2.6% |
| Standard Deviation (Sample) | 3.9% | 4.4% |
| Standard Deviation (Population) | 3.9% | 4.3% |
Similar Demographics by Female Disability
Demographics Similar to Barbadians by Female Disability
In terms of female disability, the demographic groups most similar to Barbadians are Yugoslavian (12.6%, a difference of 0.030%), Slavic (12.6%, a difference of 0.060%), German Russian (12.6%, a difference of 0.090%), Immigrants from West Indies (12.6%, a difference of 0.19%), and Japanese (12.6%, a difference of 0.26%).
| Demographics | Rating | Rank | Female Disability |
| Immigrants | Somalia | 5.9 /100 | #232 | Tragic 12.5% |
| Immigrants | Iraq | 5.3 /100 | #233 | Tragic 12.5% |
| Scandinavians | 5.3 /100 | #234 | Tragic 12.5% |
| Malaysians | 5.0 /100 | #235 | Tragic 12.5% |
| Immigrants | West Indies | 4.4 /100 | #236 | Tragic 12.6% |
| Slavs | 3.8 /100 | #237 | Tragic 12.6% |
| Yugoslavians | 3.7 /100 | #238 | Tragic 12.6% |
| Barbadians | 3.6 /100 | #239 | Tragic 12.6% |
| German Russians | 3.2 /100 | #240 | Tragic 12.6% |
| Japanese | 2.7 /100 | #241 | Tragic 12.6% |
| Canadians | 2.6 /100 | #242 | Tragic 12.6% |
| Immigrants | Senegal | 2.5 /100 | #243 | Tragic 12.6% |
| Alsatians | 2.5 /100 | #244 | Tragic 12.6% |
| Immigrants | Jamaica | 2.2 /100 | #245 | Tragic 12.6% |
| Spanish American Indians | 2.1 /100 | #246 | Tragic 12.6% |
Demographics Similar to Immigrants from Western Africa by Female Disability
In terms of female disability, the demographic groups most similar to Immigrants from Western Africa are Armenian (12.3%, a difference of 0.020%), Northern European (12.3%, a difference of 0.080%), Immigrants from Honduras (12.3%, a difference of 0.090%), Ukrainian (12.3%, a difference of 0.090%), and Immigrants from Albania (12.3%, a difference of 0.10%).
| Demographics | Rating | Rank | Female Disability |
| Immigrants | Uzbekistan | 33.9 /100 | #185 | Fair 12.3% |
| Austrians | 33.3 /100 | #186 | Fair 12.3% |
| Serbians | 33.1 /100 | #187 | Fair 12.3% |
| Immigrants | North America | 32.8 /100 | #188 | Fair 12.3% |
| Immigrants | Albania | 31.6 /100 | #189 | Fair 12.3% |
| Immigrants | Honduras | 31.3 /100 | #190 | Fair 12.3% |
| Armenians | 29.7 /100 | #191 | Fair 12.3% |
| Immigrants | Western Africa | 29.2 /100 | #192 | Fair 12.3% |
| Northern Europeans | 27.5 /100 | #193 | Fair 12.3% |
| Ukrainians | 27.2 /100 | #194 | Fair 12.3% |
| Swedes | 26.6 /100 | #195 | Fair 12.3% |
| Immigrants | Panama | 25.5 /100 | #196 | Fair 12.3% |
| Hondurans | 25.4 /100 | #197 | Fair 12.3% |
| Mexican American Indians | 24.9 /100 | #198 | Fair 12.3% |
| Immigrants | Trinidad and Tobago | 24.7 /100 | #199 | Fair 12.3% |