Immigrants from Iraq vs Immigrants from Western Africa Female Disability
COMPARE
Immigrants from Iraq
Immigrants from Western Africa
Female Disability
Female Disability Comparison
Immigrants from Iraq
Immigrants from Western Africa
12.5%
FEMALE DISABILITY
5.3/ 100
METRIC RATING
233rd/ 347
METRIC RANK
12.3%
FEMALE DISABILITY
29.2/ 100
METRIC RATING
192nd/ 347
METRIC RANK
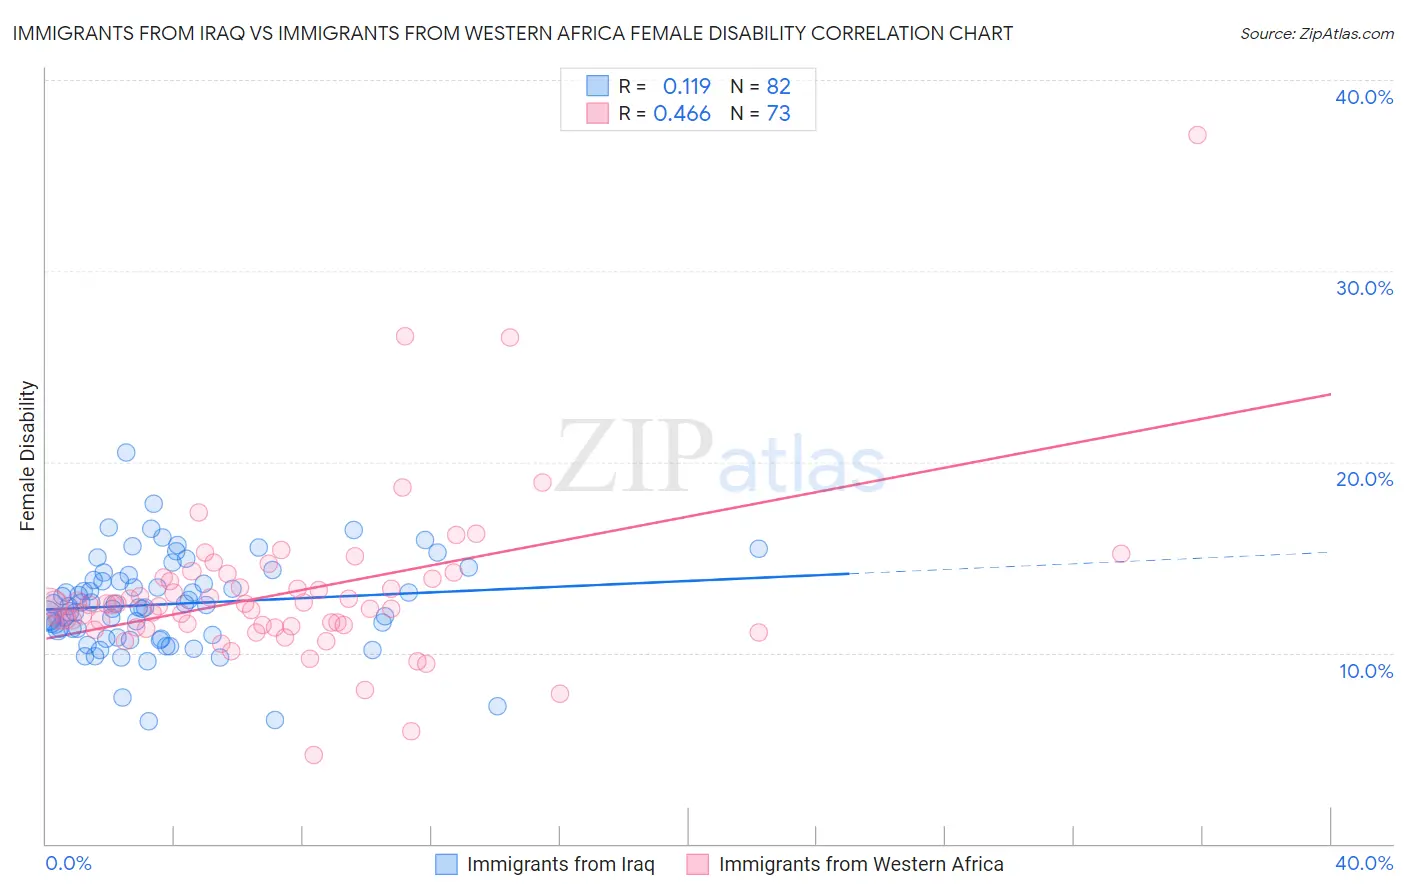
Immigrants from Iraq vs Immigrants from Western Africa Female Disability Correlation Chart
The statistical analysis conducted on geographies consisting of 194,760,840 people shows a poor positive correlation between the proportion of Immigrants from Iraq and percentage of females with a disability in the United States with a correlation coefficient (R) of 0.119 and weighted average of 12.5%. Similarly, the statistical analysis conducted on geographies consisting of 357,800,651 people shows a moderate positive correlation between the proportion of Immigrants from Western Africa and percentage of females with a disability in the United States with a correlation coefficient (R) of 0.466 and weighted average of 12.3%, a difference of 1.9%.
Female Disability Correlation Summary
| Measurement | Immigrants from Iraq | Immigrants from Western Africa |
| Minimum | 6.4% | 4.6% |
| Maximum | 20.5% | 37.1% |
| Range | 14.1% | 32.5% |
| Mean | 12.5% | 13.1% |
| Median | 12.5% | 12.5% |
| Interquartile 25% (IQ1) | 10.9% | 11.3% |
| Interquartile 75% (IQ3) | 13.8% | 13.9% |
| Interquartile Range (IQR) | 2.9% | 2.6% |
| Standard Deviation (Sample) | 2.4% | 4.4% |
| Standard Deviation (Population) | 2.4% | 4.3% |
Similar Demographics by Female Disability
Demographics Similar to Immigrants from Iraq by Female Disability
In terms of female disability, the demographic groups most similar to Immigrants from Iraq are Scandinavian (12.5%, a difference of 0.010%), Malaysian (12.5%, a difference of 0.060%), Immigrants from Somalia (12.5%, a difference of 0.10%), Belgian (12.5%, a difference of 0.19%), and Immigrants from West Indies (12.6%, a difference of 0.19%).
| Demographics | Rating | Rank | Female Disability |
| Hispanics or Latinos | 8.0 /100 | #226 | Tragic 12.5% |
| Assyrians/Chaldeans/Syriacs | 8.0 /100 | #227 | Tragic 12.5% |
| Immigrants | Cambodia | 7.8 /100 | #228 | Tragic 12.5% |
| Hungarians | 7.2 /100 | #229 | Tragic 12.5% |
| Immigrants | Belize | 7.0 /100 | #230 | Tragic 12.5% |
| Belgians | 6.5 /100 | #231 | Tragic 12.5% |
| Immigrants | Somalia | 5.9 /100 | #232 | Tragic 12.5% |
| Immigrants | Iraq | 5.3 /100 | #233 | Tragic 12.5% |
| Scandinavians | 5.3 /100 | #234 | Tragic 12.5% |
| Malaysians | 5.0 /100 | #235 | Tragic 12.5% |
| Immigrants | West Indies | 4.4 /100 | #236 | Tragic 12.6% |
| Slavs | 3.8 /100 | #237 | Tragic 12.6% |
| Yugoslavians | 3.7 /100 | #238 | Tragic 12.6% |
| Barbadians | 3.6 /100 | #239 | Tragic 12.6% |
| German Russians | 3.2 /100 | #240 | Tragic 12.6% |
Demographics Similar to Immigrants from Western Africa by Female Disability
In terms of female disability, the demographic groups most similar to Immigrants from Western Africa are Armenian (12.3%, a difference of 0.020%), Northern European (12.3%, a difference of 0.080%), Immigrants from Honduras (12.3%, a difference of 0.090%), Ukrainian (12.3%, a difference of 0.090%), and Immigrants from Albania (12.3%, a difference of 0.10%).
| Demographics | Rating | Rank | Female Disability |
| Immigrants | Uzbekistan | 33.9 /100 | #185 | Fair 12.3% |
| Austrians | 33.3 /100 | #186 | Fair 12.3% |
| Serbians | 33.1 /100 | #187 | Fair 12.3% |
| Immigrants | North America | 32.8 /100 | #188 | Fair 12.3% |
| Immigrants | Albania | 31.6 /100 | #189 | Fair 12.3% |
| Immigrants | Honduras | 31.3 /100 | #190 | Fair 12.3% |
| Armenians | 29.7 /100 | #191 | Fair 12.3% |
| Immigrants | Western Africa | 29.2 /100 | #192 | Fair 12.3% |
| Northern Europeans | 27.5 /100 | #193 | Fair 12.3% |
| Ukrainians | 27.2 /100 | #194 | Fair 12.3% |
| Swedes | 26.6 /100 | #195 | Fair 12.3% |
| Immigrants | Panama | 25.5 /100 | #196 | Fair 12.3% |
| Hondurans | 25.4 /100 | #197 | Fair 12.3% |
| Mexican American Indians | 24.9 /100 | #198 | Fair 12.3% |
| Immigrants | Trinidad and Tobago | 24.7 /100 | #199 | Fair 12.3% |