Immigrants from Laos vs Immigrants from Western Africa Female Disability
COMPARE
Immigrants from Laos
Immigrants from Western Africa
Female Disability
Female Disability Comparison
Immigrants from Laos
Immigrants from Western Africa
12.8%
FEMALE DISABILITY
0.4/ 100
METRIC RATING
268th/ 347
METRIC RANK
12.3%
FEMALE DISABILITY
29.2/ 100
METRIC RATING
192nd/ 347
METRIC RANK
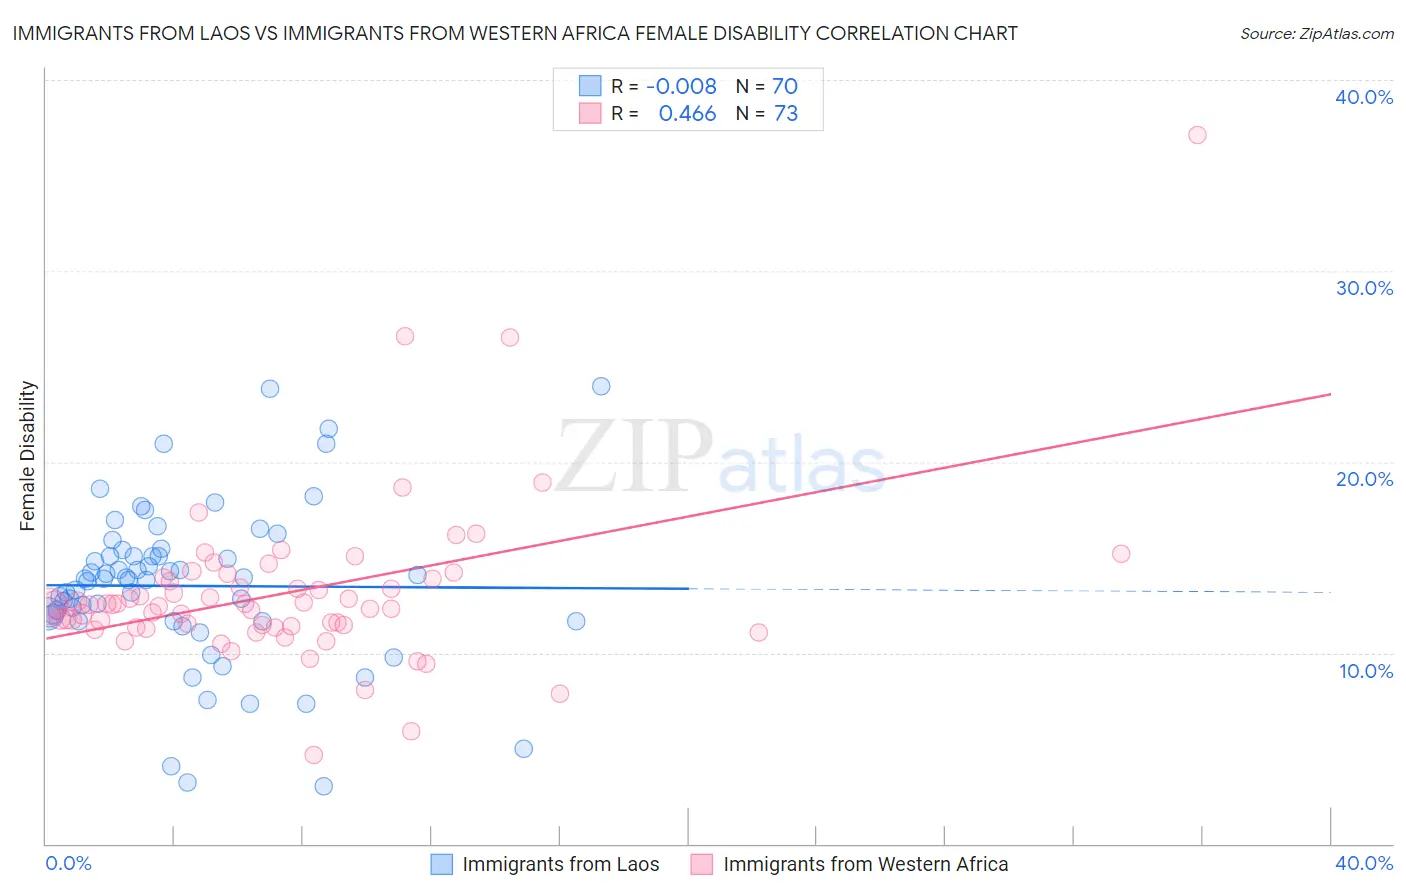
Immigrants from Laos vs Immigrants from Western Africa Female Disability Correlation Chart
The statistical analysis conducted on geographies consisting of 201,465,776 people shows no correlation between the proportion of Immigrants from Laos and percentage of females with a disability in the United States with a correlation coefficient (R) of -0.008 and weighted average of 12.8%. Similarly, the statistical analysis conducted on geographies consisting of 357,800,651 people shows a moderate positive correlation between the proportion of Immigrants from Western Africa and percentage of females with a disability in the United States with a correlation coefficient (R) of 0.466 and weighted average of 12.3%, a difference of 4.3%.
Female Disability Correlation Summary
| Measurement | Immigrants from Laos | Immigrants from Western Africa |
| Minimum | 3.0% | 4.6% |
| Maximum | 24.0% | 37.1% |
| Range | 20.9% | 32.5% |
| Mean | 13.5% | 13.1% |
| Median | 13.9% | 12.5% |
| Interquartile 25% (IQ1) | 11.7% | 11.3% |
| Interquartile 75% (IQ3) | 15.1% | 13.9% |
| Interquartile Range (IQR) | 3.4% | 2.6% |
| Standard Deviation (Sample) | 4.1% | 4.4% |
| Standard Deviation (Population) | 4.1% | 4.3% |
Similar Demographics by Female Disability
Demographics Similar to Immigrants from Laos by Female Disability
In terms of female disability, the demographic groups most similar to Immigrants from Laos are Senegalese (12.8%, a difference of 0.030%), Finnish (12.8%, a difference of 0.040%), Indonesian (12.8%, a difference of 0.060%), West Indian (12.8%, a difference of 0.16%), and Immigrants from Liberia (12.9%, a difference of 0.24%).
| Demographics | Rating | Rank | Female Disability |
| Bermudans | 1.0 /100 | #261 | Tragic 12.7% |
| Czechoslovakians | 0.9 /100 | #262 | Tragic 12.7% |
| Spaniards | 0.7 /100 | #263 | Tragic 12.8% |
| Alaska Natives | 0.6 /100 | #264 | Tragic 12.8% |
| West Indians | 0.5 /100 | #265 | Tragic 12.8% |
| Finns | 0.4 /100 | #266 | Tragic 12.8% |
| Senegalese | 0.4 /100 | #267 | Tragic 12.8% |
| Immigrants | Laos | 0.4 /100 | #268 | Tragic 12.8% |
| Indonesians | 0.4 /100 | #269 | Tragic 12.8% |
| Immigrants | Liberia | 0.3 /100 | #270 | Tragic 12.9% |
| Dutch | 0.2 /100 | #271 | Tragic 12.9% |
| Germans | 0.1 /100 | #272 | Tragic 12.9% |
| Sioux | 0.1 /100 | #273 | Tragic 12.9% |
| Portuguese | 0.1 /100 | #274 | Tragic 13.0% |
| Cheyenne | 0.1 /100 | #275 | Tragic 13.0% |
Demographics Similar to Immigrants from Western Africa by Female Disability
In terms of female disability, the demographic groups most similar to Immigrants from Western Africa are Armenian (12.3%, a difference of 0.020%), Northern European (12.3%, a difference of 0.080%), Immigrants from Honduras (12.3%, a difference of 0.090%), Ukrainian (12.3%, a difference of 0.090%), and Immigrants from Albania (12.3%, a difference of 0.10%).
| Demographics | Rating | Rank | Female Disability |
| Immigrants | Uzbekistan | 33.9 /100 | #185 | Fair 12.3% |
| Austrians | 33.3 /100 | #186 | Fair 12.3% |
| Serbians | 33.1 /100 | #187 | Fair 12.3% |
| Immigrants | North America | 32.8 /100 | #188 | Fair 12.3% |
| Immigrants | Albania | 31.6 /100 | #189 | Fair 12.3% |
| Immigrants | Honduras | 31.3 /100 | #190 | Fair 12.3% |
| Armenians | 29.7 /100 | #191 | Fair 12.3% |
| Immigrants | Western Africa | 29.2 /100 | #192 | Fair 12.3% |
| Northern Europeans | 27.5 /100 | #193 | Fair 12.3% |
| Ukrainians | 27.2 /100 | #194 | Fair 12.3% |
| Swedes | 26.6 /100 | #195 | Fair 12.3% |
| Immigrants | Panama | 25.5 /100 | #196 | Fair 12.3% |
| Hondurans | 25.4 /100 | #197 | Fair 12.3% |
| Mexican American Indians | 24.9 /100 | #198 | Fair 12.3% |
| Immigrants | Trinidad and Tobago | 24.7 /100 | #199 | Fair 12.3% |