Greek vs Immigrants from Western Africa Female Unemployment
COMPARE
Greek
Immigrants from Western Africa
Female Unemployment
Female Unemployment Comparison
Greeks
Immigrants from Western Africa
4.9%
FEMALE UNEMPLOYMENT
99.4/ 100
METRIC RATING
44th/ 347
METRIC RANK
5.9%
FEMALE UNEMPLOYMENT
0.0/ 100
METRIC RATING
269th/ 347
METRIC RANK
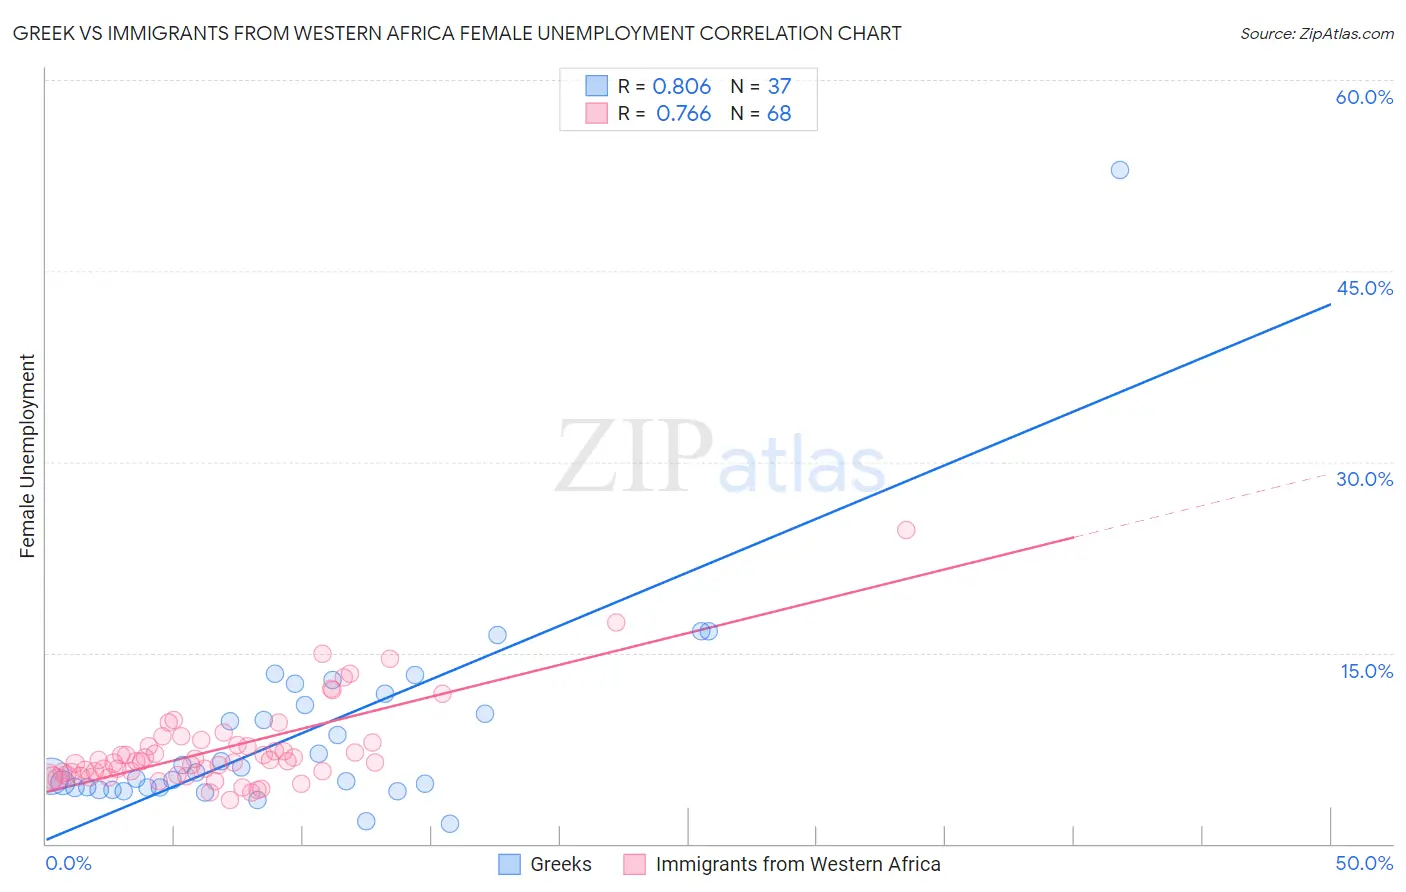
Greek vs Immigrants from Western Africa Female Unemployment Correlation Chart
The statistical analysis conducted on geographies consisting of 478,278,385 people shows a very strong positive correlation between the proportion of Greeks and unemploymnet rate among females in the United States with a correlation coefficient (R) of 0.806 and weighted average of 4.9%. Similarly, the statistical analysis conducted on geographies consisting of 356,869,554 people shows a strong positive correlation between the proportion of Immigrants from Western Africa and unemploymnet rate among females in the United States with a correlation coefficient (R) of 0.766 and weighted average of 5.9%, a difference of 21.5%.
Female Unemployment Correlation Summary
| Measurement | Greek | Immigrants from Western Africa |
| Minimum | 1.6% | 3.4% |
| Maximum | 52.9% | 24.6% |
| Range | 51.3% | 21.2% |
| Mean | 8.7% | 7.4% |
| Median | 5.6% | 6.5% |
| Interquartile 25% (IQ1) | 4.4% | 5.4% |
| Interquartile 75% (IQ3) | 11.4% | 7.9% |
| Interquartile Range (IQR) | 7.0% | 2.5% |
| Standard Deviation (Sample) | 8.6% | 3.5% |
| Standard Deviation (Population) | 8.5% | 3.5% |
Similar Demographics by Female Unemployment
Demographics Similar to Greeks by Female Unemployment
In terms of female unemployment, the demographic groups most similar to Greeks are Austrian (4.9%, a difference of 0.080%), Immigrants from Bulgaria (4.9%, a difference of 0.10%), Eastern European (4.9%, a difference of 0.11%), Okinawan (4.9%, a difference of 0.19%), and Italian (4.8%, a difference of 0.28%).
| Demographics | Rating | Rank | Female Unemployment |
| Pennsylvania Germans | 99.6 /100 | #37 | Exceptional 4.8% |
| Northern Europeans | 99.6 /100 | #38 | Exceptional 4.8% |
| Scotch-Irish | 99.6 /100 | #39 | Exceptional 4.8% |
| French | 99.6 /100 | #40 | Exceptional 4.8% |
| Tongans | 99.5 /100 | #41 | Exceptional 4.8% |
| Italians | 99.5 /100 | #42 | Exceptional 4.8% |
| Eastern Europeans | 99.4 /100 | #43 | Exceptional 4.9% |
| Greeks | 99.4 /100 | #44 | Exceptional 4.9% |
| Austrians | 99.3 /100 | #45 | Exceptional 4.9% |
| Immigrants | Bulgaria | 99.3 /100 | #46 | Exceptional 4.9% |
| Okinawans | 99.3 /100 | #47 | Exceptional 4.9% |
| Thais | 99.2 /100 | #48 | Exceptional 4.9% |
| Australians | 99.2 /100 | #49 | Exceptional 4.9% |
| Immigrants | Cuba | 99.1 /100 | #50 | Exceptional 4.9% |
| Cambodians | 99.1 /100 | #51 | Exceptional 4.9% |
Demographics Similar to Immigrants from Western Africa by Female Unemployment
In terms of female unemployment, the demographic groups most similar to Immigrants from Western Africa are Honduran (5.9%, a difference of 0.20%), Nepalese (5.9%, a difference of 0.30%), Cape Verdean (5.9%, a difference of 0.40%), Immigrants from Honduras (5.9%, a difference of 0.41%), and Central American (5.9%, a difference of 0.51%).
| Demographics | Rating | Rank | Female Unemployment |
| Immigrants | Nigeria | 0.1 /100 | #262 | Tragic 5.8% |
| Immigrants | Azores | 0.1 /100 | #263 | Tragic 5.8% |
| Immigrants | Bahamas | 0.1 /100 | #264 | Tragic 5.8% |
| Blackfeet | 0.0 /100 | #265 | Tragic 5.9% |
| Cape Verdeans | 0.0 /100 | #266 | Tragic 5.9% |
| Nepalese | 0.0 /100 | #267 | Tragic 5.9% |
| Hondurans | 0.0 /100 | #268 | Tragic 5.9% |
| Immigrants | Western Africa | 0.0 /100 | #269 | Tragic 5.9% |
| Immigrants | Honduras | 0.0 /100 | #270 | Tragic 5.9% |
| Central Americans | 0.0 /100 | #271 | Tragic 5.9% |
| Lumbee | 0.0 /100 | #272 | Tragic 5.9% |
| Ghanaians | 0.0 /100 | #273 | Tragic 5.9% |
| Africans | 0.0 /100 | #274 | Tragic 5.9% |
| Senegalese | 0.0 /100 | #275 | Tragic 6.0% |
| Bahamians | 0.0 /100 | #276 | Tragic 6.0% |