Immigrants from Nicaragua vs Immigrants from Israel Hearing Disability
COMPARE
Immigrants from Nicaragua
Immigrants from Israel
Hearing Disability
Hearing Disability Comparison
Immigrants from Nicaragua
Immigrants from Israel
2.7%
HEARING DISABILITY
99.0/ 100
METRIC RATING
56th/ 347
METRIC RANK
2.6%
HEARING DISABILITY
99.3/ 100
METRIC RATING
47th/ 347
METRIC RANK
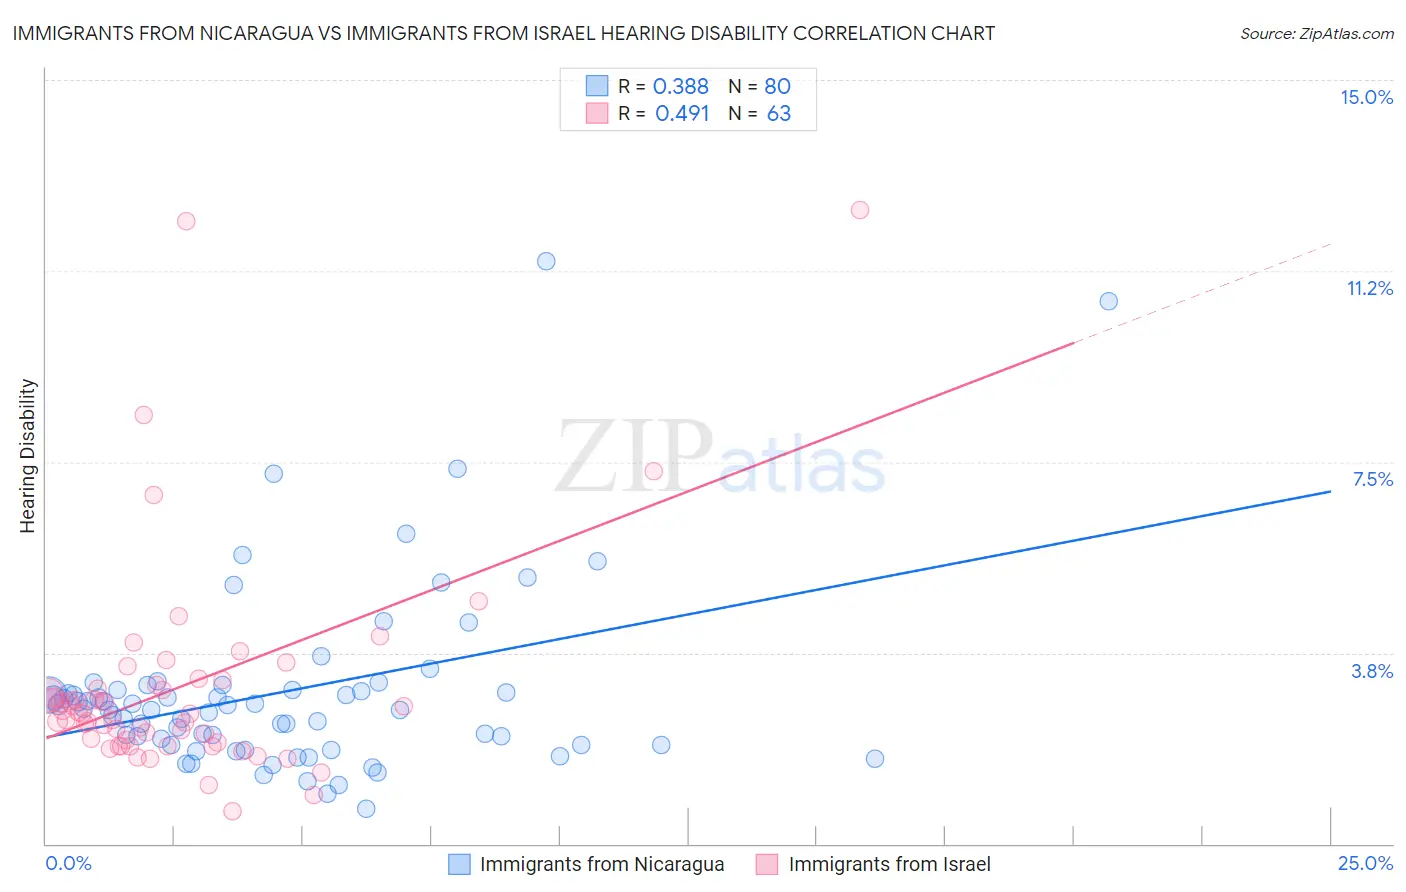
Immigrants from Nicaragua vs Immigrants from Israel Hearing Disability Correlation Chart
The statistical analysis conducted on geographies consisting of 236,296,931 people shows a mild positive correlation between the proportion of Immigrants from Nicaragua and percentage of population with hearing disability in the United States with a correlation coefficient (R) of 0.388 and weighted average of 2.7%. Similarly, the statistical analysis conducted on geographies consisting of 210,020,073 people shows a moderate positive correlation between the proportion of Immigrants from Israel and percentage of population with hearing disability in the United States with a correlation coefficient (R) of 0.491 and weighted average of 2.6%, a difference of 0.99%.
Hearing Disability Correlation Summary
| Measurement | Immigrants from Nicaragua | Immigrants from Israel |
| Minimum | 0.69% | 0.64% |
| Maximum | 11.4% | 12.4% |
| Range | 10.7% | 11.8% |
| Mean | 3.0% | 3.1% |
| Median | 2.6% | 2.5% |
| Interquartile 25% (IQ1) | 1.9% | 2.0% |
| Interquartile 75% (IQ3) | 3.0% | 3.1% |
| Interquartile Range (IQR) | 1.1% | 1.1% |
| Standard Deviation (Sample) | 1.8% | 2.1% |
| Standard Deviation (Population) | 1.8% | 2.1% |
Demographics Similar to Immigrants from Nicaragua and Immigrants from Israel by Hearing Disability
In terms of hearing disability, the demographic groups most similar to Immigrants from Nicaragua are Immigrants from Ethiopia (2.7%, a difference of 0.020%), South American (2.7%, a difference of 0.040%), Ethiopian (2.7%, a difference of 0.090%), Immigrants from Eastern Asia (2.7%, a difference of 0.12%), and Jamaican (2.7%, a difference of 0.19%). Similarly, the demographic groups most similar to Immigrants from Israel are Immigrants from Singapore (2.6%, a difference of 0.070%), Immigrants from Dominica (2.6%, a difference of 0.15%), Immigrants from South America (2.7%, a difference of 0.19%), Venezuelan (2.6%, a difference of 0.25%), and Nigerian (2.6%, a difference of 0.28%).
| Demographics | Rating | Rank | Hearing Disability |
| Immigrants | Taiwan | 99.4 /100 | #41 | Exceptional 2.6% |
| West Indians | 99.4 /100 | #42 | Exceptional 2.6% |
| Senegalese | 99.4 /100 | #43 | Exceptional 2.6% |
| Nigerians | 99.4 /100 | #44 | Exceptional 2.6% |
| Venezuelans | 99.4 /100 | #45 | Exceptional 2.6% |
| Immigrants | Dominica | 99.3 /100 | #46 | Exceptional 2.6% |
| Immigrants | Israel | 99.3 /100 | #47 | Exceptional 2.6% |
| Immigrants | Singapore | 99.3 /100 | #48 | Exceptional 2.6% |
| Immigrants | South America | 99.2 /100 | #49 | Exceptional 2.7% |
| Paraguayans | 99.2 /100 | #50 | Exceptional 2.7% |
| Immigrants | Hong Kong | 99.2 /100 | #51 | Exceptional 2.7% |
| Jamaicans | 99.0 /100 | #52 | Exceptional 2.7% |
| Immigrants | Eastern Asia | 99.0 /100 | #53 | Exceptional 2.7% |
| Ethiopians | 99.0 /100 | #54 | Exceptional 2.7% |
| Immigrants | Ethiopia | 99.0 /100 | #55 | Exceptional 2.7% |
| Immigrants | Nicaragua | 99.0 /100 | #56 | Exceptional 2.7% |
| South Americans | 99.0 /100 | #57 | Exceptional 2.7% |
| Immigrants | Peru | 98.6 /100 | #58 | Exceptional 2.7% |
| Immigrants | Eritrea | 98.5 /100 | #59 | Exceptional 2.7% |
| Immigrants | Egypt | 98.5 /100 | #60 | Exceptional 2.7% |
| Immigrants | Uzbekistan | 98.4 /100 | #61 | Exceptional 2.7% |