Kenyan vs Immigrants from Israel Hearing Disability
COMPARE
Kenyan
Immigrants from Israel
Hearing Disability
Hearing Disability Comparison
Kenyans
Immigrants from Israel
2.8%
HEARING DISABILITY
89.8/ 100
METRIC RATING
119th/ 347
METRIC RANK
2.6%
HEARING DISABILITY
99.3/ 100
METRIC RATING
47th/ 347
METRIC RANK
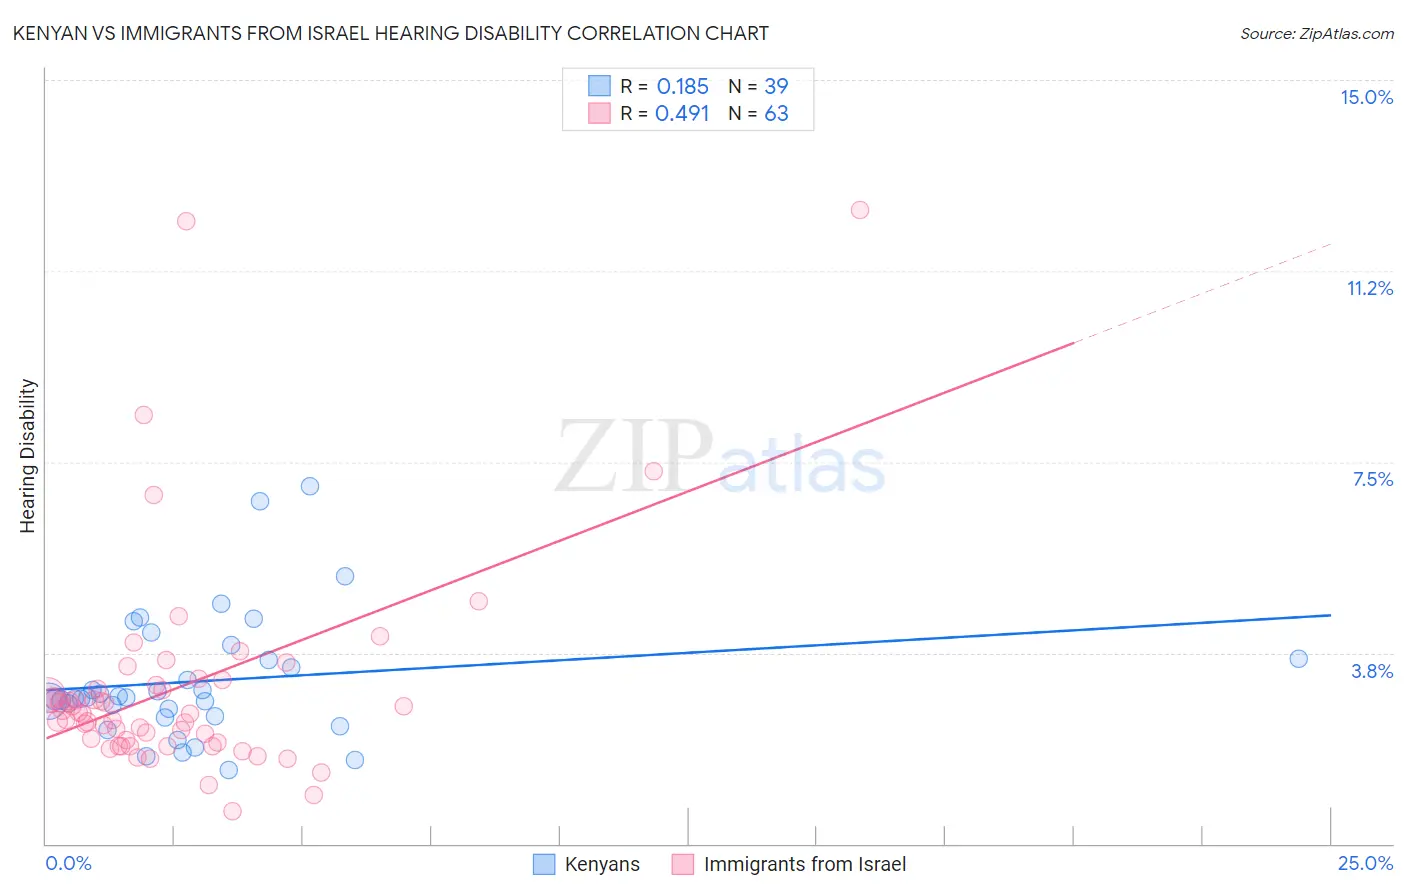
Kenyan vs Immigrants from Israel Hearing Disability Correlation Chart
The statistical analysis conducted on geographies consisting of 168,202,963 people shows a poor positive correlation between the proportion of Kenyans and percentage of population with hearing disability in the United States with a correlation coefficient (R) of 0.185 and weighted average of 2.8%. Similarly, the statistical analysis conducted on geographies consisting of 210,020,073 people shows a moderate positive correlation between the proportion of Immigrants from Israel and percentage of population with hearing disability in the United States with a correlation coefficient (R) of 0.491 and weighted average of 2.6%, a difference of 7.3%.
Hearing Disability Correlation Summary
| Measurement | Kenyan | Immigrants from Israel |
| Minimum | 1.5% | 0.64% |
| Maximum | 7.0% | 12.4% |
| Range | 5.6% | 11.8% |
| Mean | 3.2% | 3.1% |
| Median | 2.9% | 2.5% |
| Interquartile 25% (IQ1) | 2.5% | 2.0% |
| Interquartile 75% (IQ3) | 3.6% | 3.1% |
| Interquartile Range (IQR) | 1.1% | 1.1% |
| Standard Deviation (Sample) | 1.2% | 2.1% |
| Standard Deviation (Population) | 1.2% | 2.1% |
Similar Demographics by Hearing Disability
Demographics Similar to Kenyans by Hearing Disability
In terms of hearing disability, the demographic groups most similar to Kenyans are Zimbabwean (2.8%, a difference of 0.020%), Immigrants from Liberia (2.8%, a difference of 0.030%), Jordanian (2.8%, a difference of 0.090%), Immigrants (2.8%, a difference of 0.12%), and Cuban (2.8%, a difference of 0.12%).
| Demographics | Rating | Rank | Hearing Disability |
| U.S. Virgin Islanders | 92.5 /100 | #112 | Exceptional 2.8% |
| Immigrants | Belarus | 91.6 /100 | #113 | Exceptional 2.8% |
| Cambodians | 91.1 /100 | #114 | Exceptional 2.8% |
| Immigrants | Latin America | 90.5 /100 | #115 | Exceptional 2.8% |
| Immigrants | Immigrants | 90.3 /100 | #116 | Exceptional 2.8% |
| Immigrants | Liberia | 90.0 /100 | #117 | Excellent 2.8% |
| Zimbabweans | 89.9 /100 | #118 | Excellent 2.8% |
| Kenyans | 89.8 /100 | #119 | Excellent 2.8% |
| Jordanians | 89.5 /100 | #120 | Excellent 2.8% |
| Cubans | 89.4 /100 | #121 | Excellent 2.8% |
| Liberians | 89.0 /100 | #122 | Excellent 2.8% |
| Immigrants | Zaire | 88.6 /100 | #123 | Excellent 2.9% |
| Bahamians | 88.6 /100 | #124 | Excellent 2.9% |
| Immigrants | Albania | 88.5 /100 | #125 | Excellent 2.9% |
| Immigrants | Sudan | 87.8 /100 | #126 | Excellent 2.9% |
Demographics Similar to Immigrants from Israel by Hearing Disability
In terms of hearing disability, the demographic groups most similar to Immigrants from Israel are Immigrants from Singapore (2.6%, a difference of 0.070%), Immigrants from Dominica (2.6%, a difference of 0.15%), Immigrants from South America (2.7%, a difference of 0.19%), Venezuelan (2.6%, a difference of 0.25%), and Nigerian (2.6%, a difference of 0.28%).
| Demographics | Rating | Rank | Hearing Disability |
| Haitians | 99.5 /100 | #40 | Exceptional 2.6% |
| Immigrants | Taiwan | 99.4 /100 | #41 | Exceptional 2.6% |
| West Indians | 99.4 /100 | #42 | Exceptional 2.6% |
| Senegalese | 99.4 /100 | #43 | Exceptional 2.6% |
| Nigerians | 99.4 /100 | #44 | Exceptional 2.6% |
| Venezuelans | 99.4 /100 | #45 | Exceptional 2.6% |
| Immigrants | Dominica | 99.3 /100 | #46 | Exceptional 2.6% |
| Immigrants | Israel | 99.3 /100 | #47 | Exceptional 2.6% |
| Immigrants | Singapore | 99.3 /100 | #48 | Exceptional 2.6% |
| Immigrants | South America | 99.2 /100 | #49 | Exceptional 2.7% |
| Paraguayans | 99.2 /100 | #50 | Exceptional 2.7% |
| Immigrants | Hong Kong | 99.2 /100 | #51 | Exceptional 2.7% |
| Jamaicans | 99.0 /100 | #52 | Exceptional 2.7% |
| Immigrants | Eastern Asia | 99.0 /100 | #53 | Exceptional 2.7% |
| Ethiopians | 99.0 /100 | #54 | Exceptional 2.7% |