Swedish vs Immigrants from Haiti Cognitive Disability
COMPARE
Swedish
Immigrants from Haiti
Cognitive Disability
Cognitive Disability Comparison
Swedes
Immigrants from Haiti
16.5%
COGNITIVE DISABILITY
99.8/ 100
METRIC RATING
53rd/ 347
METRIC RANK
17.4%
COGNITIVE DISABILITY
27.1/ 100
METRIC RATING
192nd/ 347
METRIC RANK
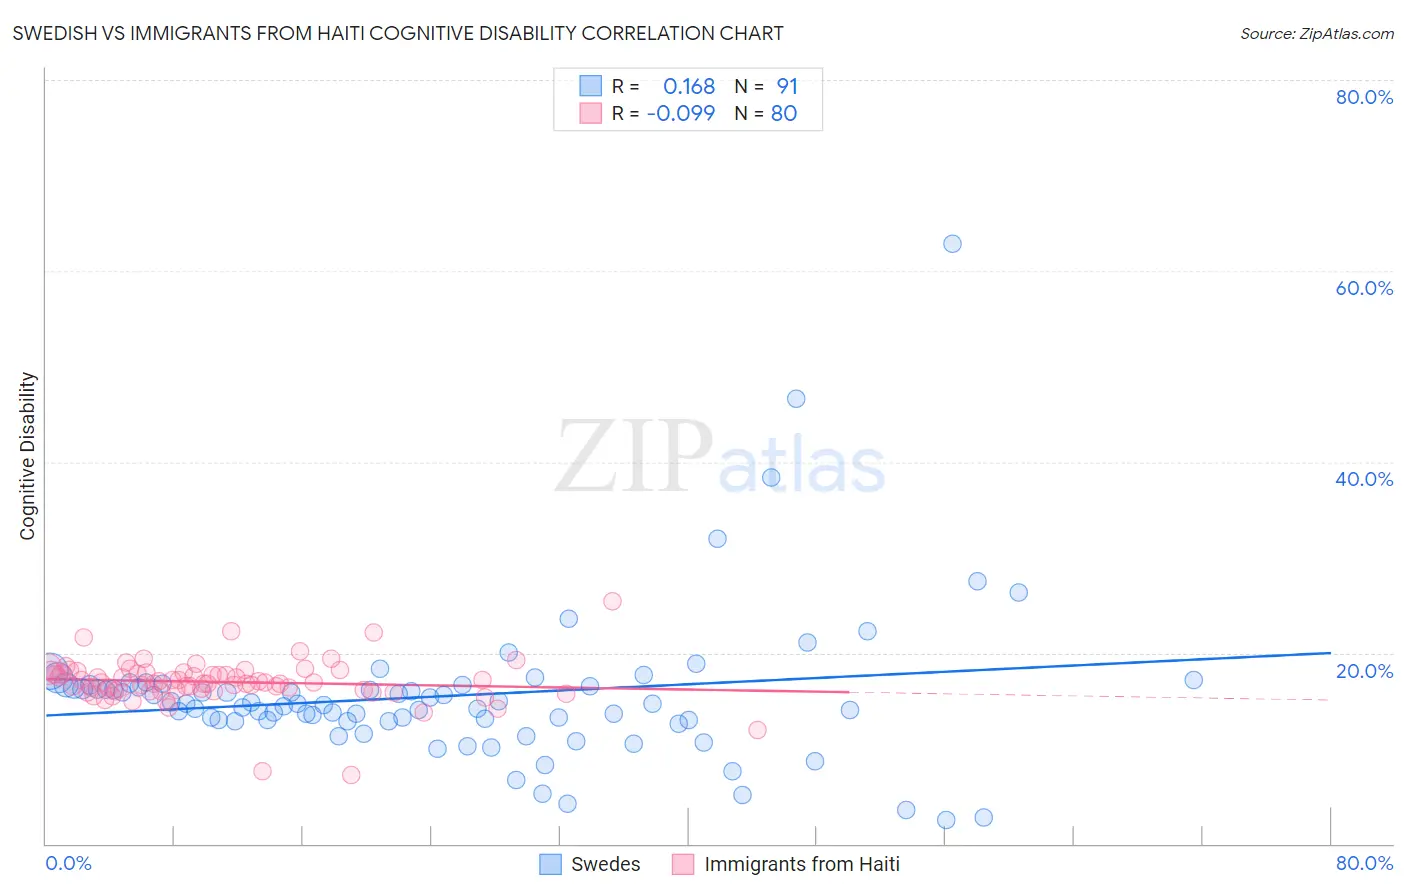
Swedish vs Immigrants from Haiti Cognitive Disability Correlation Chart
The statistical analysis conducted on geographies consisting of 539,118,311 people shows a poor positive correlation between the proportion of Swedes and percentage of population with cognitive disability in the United States with a correlation coefficient (R) of 0.168 and weighted average of 16.5%. Similarly, the statistical analysis conducted on geographies consisting of 225,240,715 people shows a slight negative correlation between the proportion of Immigrants from Haiti and percentage of population with cognitive disability in the United States with a correlation coefficient (R) of -0.099 and weighted average of 17.4%, a difference of 5.3%.
Cognitive Disability Correlation Summary
| Measurement | Swedish | Immigrants from Haiti |
| Minimum | 2.5% | 7.3% |
| Maximum | 62.8% | 25.4% |
| Range | 60.2% | 18.2% |
| Mean | 15.5% | 16.9% |
| Median | 14.6% | 16.9% |
| Interquartile 25% (IQ1) | 12.9% | 16.0% |
| Interquartile 75% (IQ3) | 16.6% | 17.9% |
| Interquartile Range (IQR) | 3.7% | 1.9% |
| Standard Deviation (Sample) | 8.1% | 2.4% |
| Standard Deviation (Population) | 8.0% | 2.4% |
Similar Demographics by Cognitive Disability
Demographics Similar to Swedes by Cognitive Disability
In terms of cognitive disability, the demographic groups most similar to Swedes are Immigrants from Iran (16.5%, a difference of 0.040%), Soviet Union (16.5%, a difference of 0.060%), Immigrants from Korea (16.5%, a difference of 0.10%), Immigrants from Venezuela (16.5%, a difference of 0.13%), and Iranian (16.5%, a difference of 0.15%).
| Demographics | Rating | Rank | Cognitive Disability |
| Immigrants | Colombia | 99.8 /100 | #46 | Exceptional 16.5% |
| Immigrants | Italy | 99.8 /100 | #47 | Exceptional 16.5% |
| Immigrants | North America | 99.8 /100 | #48 | Exceptional 16.5% |
| Iranians | 99.8 /100 | #49 | Exceptional 16.5% |
| Norwegians | 99.8 /100 | #50 | Exceptional 16.5% |
| Immigrants | Korea | 99.8 /100 | #51 | Exceptional 16.5% |
| Soviet Union | 99.8 /100 | #52 | Exceptional 16.5% |
| Swedes | 99.8 /100 | #53 | Exceptional 16.5% |
| Immigrants | Iran | 99.8 /100 | #54 | Exceptional 16.5% |
| Immigrants | Venezuela | 99.7 /100 | #55 | Exceptional 16.5% |
| Austrians | 99.7 /100 | #56 | Exceptional 16.6% |
| Bhutanese | 99.7 /100 | #57 | Exceptional 16.6% |
| Pennsylvania Germans | 99.7 /100 | #58 | Exceptional 16.6% |
| Immigrants | Peru | 99.7 /100 | #59 | Exceptional 16.6% |
| Romanians | 99.7 /100 | #60 | Exceptional 16.6% |
Demographics Similar to Immigrants from Haiti by Cognitive Disability
In terms of cognitive disability, the demographic groups most similar to Immigrants from Haiti are Nonimmigrants (17.4%, a difference of 0.010%), Immigrants from Spain (17.4%, a difference of 0.020%), Delaware (17.4%, a difference of 0.050%), Immigrants from Western Asia (17.4%, a difference of 0.080%), and Immigrants from France (17.4%, a difference of 0.090%).
| Demographics | Rating | Rank | Cognitive Disability |
| Afghans | 38.2 /100 | #185 | Fair 17.3% |
| Cambodians | 35.9 /100 | #186 | Fair 17.3% |
| Immigrants | Fiji | 33.7 /100 | #187 | Fair 17.4% |
| Immigrants | France | 29.8 /100 | #188 | Fair 17.4% |
| Immigrants | Western Asia | 29.5 /100 | #189 | Fair 17.4% |
| Immigrants | Spain | 27.7 /100 | #190 | Fair 17.4% |
| Immigrants | Nonimmigrants | 27.4 /100 | #191 | Fair 17.4% |
| Immigrants | Haiti | 27.1 /100 | #192 | Fair 17.4% |
| Delaware | 25.6 /100 | #193 | Fair 17.4% |
| Immigrants | Bosnia and Herzegovina | 22.0 /100 | #194 | Fair 17.4% |
| New Zealanders | 21.1 /100 | #195 | Fair 17.4% |
| Guyanese | 17.5 /100 | #196 | Poor 17.5% |
| Immigrants | Afghanistan | 16.7 /100 | #197 | Poor 17.5% |
| Immigrants | Panama | 14.8 /100 | #198 | Poor 17.5% |
| Immigrants | Singapore | 14.3 /100 | #199 | Poor 17.5% |