Egyptian vs Immigrants from Haiti Cognitive Disability
COMPARE
Egyptian
Immigrants from Haiti
Cognitive Disability
Cognitive Disability Comparison
Egyptians
Immigrants from Haiti
16.7%
COGNITIVE DISABILITY
99.2/ 100
METRIC RATING
80th/ 347
METRIC RANK
17.4%
COGNITIVE DISABILITY
27.1/ 100
METRIC RATING
192nd/ 347
METRIC RANK
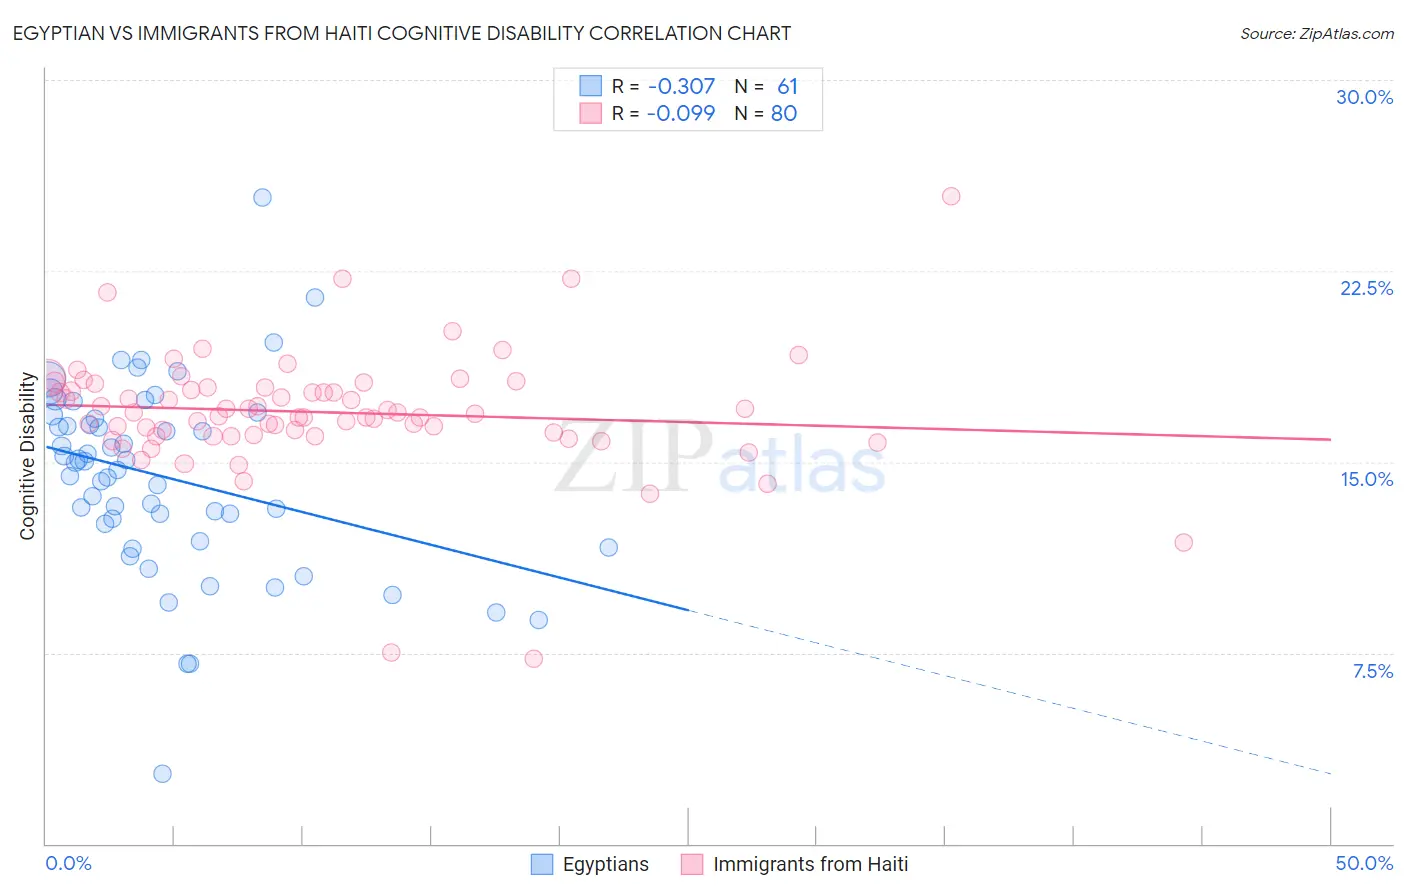
Egyptian vs Immigrants from Haiti Cognitive Disability Correlation Chart
The statistical analysis conducted on geographies consisting of 276,907,223 people shows a mild negative correlation between the proportion of Egyptians and percentage of population with cognitive disability in the United States with a correlation coefficient (R) of -0.307 and weighted average of 16.7%. Similarly, the statistical analysis conducted on geographies consisting of 225,240,715 people shows a slight negative correlation between the proportion of Immigrants from Haiti and percentage of population with cognitive disability in the United States with a correlation coefficient (R) of -0.099 and weighted average of 17.4%, a difference of 4.3%.
Cognitive Disability Correlation Summary
| Measurement | Egyptian | Immigrants from Haiti |
| Minimum | 2.7% | 7.3% |
| Maximum | 25.4% | 25.4% |
| Range | 22.7% | 18.2% |
| Mean | 14.4% | 16.9% |
| Median | 15.0% | 16.9% |
| Interquartile 25% (IQ1) | 12.2% | 16.0% |
| Interquartile 75% (IQ3) | 16.8% | 17.9% |
| Interquartile Range (IQR) | 4.6% | 1.9% |
| Standard Deviation (Sample) | 3.8% | 2.4% |
| Standard Deviation (Population) | 3.7% | 2.4% |
Similar Demographics by Cognitive Disability
Demographics Similar to Egyptians by Cognitive Disability
In terms of cognitive disability, the demographic groups most similar to Egyptians are Immigrants from Netherlands (16.7%, a difference of 0.010%), Peruvian (16.7%, a difference of 0.030%), Immigrants from Bulgaria (16.7%, a difference of 0.030%), Immigrants from Serbia (16.7%, a difference of 0.040%), and Immigrants from Hungary (16.7%, a difference of 0.040%).
| Demographics | Rating | Rank | Cognitive Disability |
| Burmese | 99.3 /100 | #73 | Exceptional 16.7% |
| Slavs | 99.3 /100 | #74 | Exceptional 16.7% |
| Estonians | 99.3 /100 | #75 | Exceptional 16.7% |
| Immigrants | Serbia | 99.3 /100 | #76 | Exceptional 16.7% |
| Immigrants | Hungary | 99.3 /100 | #77 | Exceptional 16.7% |
| Peruvians | 99.3 /100 | #78 | Exceptional 16.7% |
| Immigrants | Bulgaria | 99.3 /100 | #79 | Exceptional 16.7% |
| Egyptians | 99.2 /100 | #80 | Exceptional 16.7% |
| Immigrants | Netherlands | 99.2 /100 | #81 | Exceptional 16.7% |
| Swiss | 99.2 /100 | #82 | Exceptional 16.7% |
| Serbians | 99.1 /100 | #83 | Exceptional 16.7% |
| Belgians | 99.1 /100 | #84 | Exceptional 16.7% |
| Immigrants | Moldova | 99.1 /100 | #85 | Exceptional 16.7% |
| Immigrants | South Africa | 99.0 /100 | #86 | Exceptional 16.7% |
| Native Hawaiians | 99.0 /100 | #87 | Exceptional 16.7% |
Demographics Similar to Immigrants from Haiti by Cognitive Disability
In terms of cognitive disability, the demographic groups most similar to Immigrants from Haiti are Nonimmigrants (17.4%, a difference of 0.010%), Immigrants from Spain (17.4%, a difference of 0.020%), Delaware (17.4%, a difference of 0.050%), Immigrants from Western Asia (17.4%, a difference of 0.080%), and Immigrants from France (17.4%, a difference of 0.090%).
| Demographics | Rating | Rank | Cognitive Disability |
| Afghans | 38.2 /100 | #185 | Fair 17.3% |
| Cambodians | 35.9 /100 | #186 | Fair 17.3% |
| Immigrants | Fiji | 33.7 /100 | #187 | Fair 17.4% |
| Immigrants | France | 29.8 /100 | #188 | Fair 17.4% |
| Immigrants | Western Asia | 29.5 /100 | #189 | Fair 17.4% |
| Immigrants | Spain | 27.7 /100 | #190 | Fair 17.4% |
| Immigrants | Nonimmigrants | 27.4 /100 | #191 | Fair 17.4% |
| Immigrants | Haiti | 27.1 /100 | #192 | Fair 17.4% |
| Delaware | 25.6 /100 | #193 | Fair 17.4% |
| Immigrants | Bosnia and Herzegovina | 22.0 /100 | #194 | Fair 17.4% |
| New Zealanders | 21.1 /100 | #195 | Fair 17.4% |
| Guyanese | 17.5 /100 | #196 | Poor 17.5% |
| Immigrants | Afghanistan | 16.7 /100 | #197 | Poor 17.5% |
| Immigrants | Panama | 14.8 /100 | #198 | Poor 17.5% |
| Immigrants | Singapore | 14.3 /100 | #199 | Poor 17.5% |