German vs Yuman Vision Disability
COMPARE
German
Yuman
Vision Disability
Vision Disability Comparison
Germans
Yuman
2.2%
VISION DISABILITY
13.4/ 100
METRIC RATING
208th/ 347
METRIC RANK
3.0%
VISION DISABILITY
0.0/ 100
METRIC RATING
328th/ 347
METRIC RANK
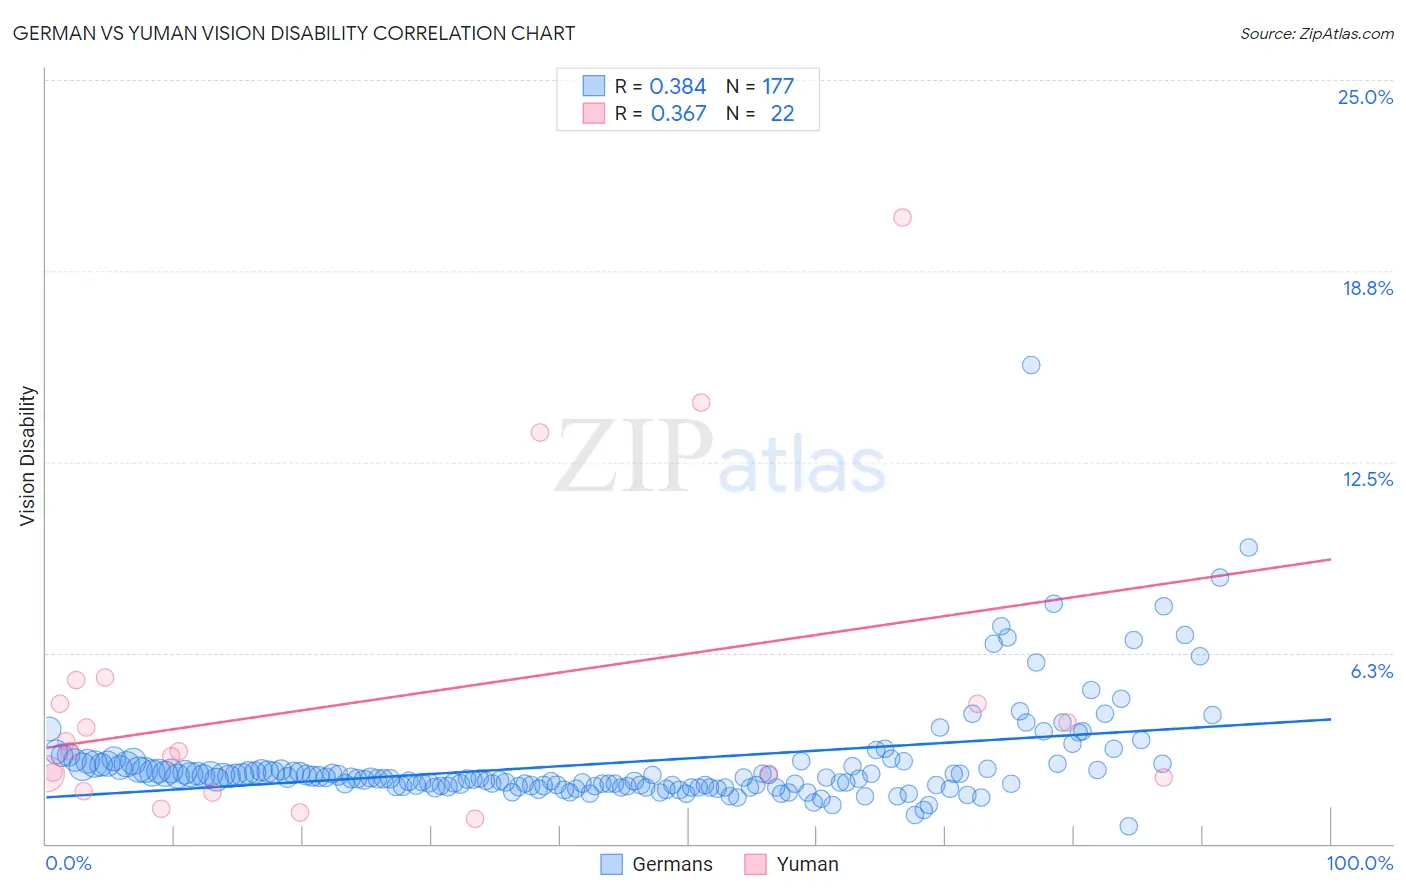
German vs Yuman Vision Disability Correlation Chart
The statistical analysis conducted on geographies consisting of 578,195,961 people shows a mild positive correlation between the proportion of Germans and percentage of population with vision disability in the United States with a correlation coefficient (R) of 0.384 and weighted average of 2.2%. Similarly, the statistical analysis conducted on geographies consisting of 40,661,627 people shows a mild positive correlation between the proportion of Yuman and percentage of population with vision disability in the United States with a correlation coefficient (R) of 0.367 and weighted average of 3.0%, a difference of 33.9%.
Vision Disability Correlation Summary
| Measurement | German | Yuman |
| Minimum | 0.58% | 0.83% |
| Maximum | 15.7% | 20.5% |
| Range | 15.1% | 19.7% |
| Mean | 2.7% | 4.7% |
| Median | 2.2% | 3.0% |
| Interquartile 25% (IQ1) | 1.9% | 2.2% |
| Interquartile 75% (IQ3) | 2.6% | 4.6% |
| Interquartile Range (IQR) | 0.71% | 2.4% |
| Standard Deviation (Sample) | 1.7% | 5.0% |
| Standard Deviation (Population) | 1.7% | 4.9% |
Similar Demographics by Vision Disability
Demographics Similar to Germans by Vision Disability
In terms of vision disability, the demographic groups most similar to Germans are Immigrants from Nigeria (2.2%, a difference of 0.010%), Immigrants from Brazil (2.2%, a difference of 0.040%), Pennsylvania German (2.2%, a difference of 0.14%), Immigrants from Uruguay (2.2%, a difference of 0.27%), and Samoan (2.2%, a difference of 0.28%).
| Demographics | Rating | Rank | Vision Disability |
| Slovaks | 18.8 /100 | #201 | Poor 2.2% |
| Immigrants | Zaire | 18.0 /100 | #202 | Poor 2.2% |
| Dutch | 17.1 /100 | #203 | Poor 2.2% |
| Immigrants | Guyana | 15.9 /100 | #204 | Poor 2.2% |
| Samoans | 15.7 /100 | #205 | Poor 2.2% |
| Pennsylvania Germans | 14.5 /100 | #206 | Poor 2.2% |
| Immigrants | Nigeria | 13.5 /100 | #207 | Poor 2.2% |
| Germans | 13.4 /100 | #208 | Poor 2.2% |
| Immigrants | Brazil | 13.1 /100 | #209 | Poor 2.2% |
| Immigrants | Uruguay | 11.5 /100 | #210 | Poor 2.2% |
| Indonesians | 9.5 /100 | #211 | Tragic 2.2% |
| Bermudans | 9.0 /100 | #212 | Tragic 2.2% |
| Immigrants | Ghana | 8.9 /100 | #213 | Tragic 2.2% |
| Trinidadians and Tobagonians | 8.2 /100 | #214 | Tragic 2.2% |
| Nigerians | 7.2 /100 | #215 | Tragic 2.3% |
Demographics Similar to Yuman by Vision Disability
In terms of vision disability, the demographic groups most similar to Yuman are Apache (3.0%, a difference of 0.19%), Native/Alaskan (3.0%, a difference of 0.54%), Spanish American (2.9%, a difference of 1.3%), Colville (3.0%, a difference of 1.4%), and Central American Indian (3.0%, a difference of 2.1%).
| Demographics | Rating | Rank | Vision Disability |
| Comanche | 0.0 /100 | #321 | Tragic 2.8% |
| Paiute | 0.0 /100 | #322 | Tragic 2.9% |
| Tlingit-Haida | 0.0 /100 | #323 | Tragic 2.9% |
| Hopi | 0.0 /100 | #324 | Tragic 2.9% |
| Cherokee | 0.0 /100 | #325 | Tragic 2.9% |
| Spanish Americans | 0.0 /100 | #326 | Tragic 2.9% |
| Natives/Alaskans | 0.0 /100 | #327 | Tragic 3.0% |
| Yuman | 0.0 /100 | #328 | Tragic 3.0% |
| Apache | 0.0 /100 | #329 | Tragic 3.0% |
| Colville | 0.0 /100 | #330 | Tragic 3.0% |
| Central American Indians | 0.0 /100 | #331 | Tragic 3.0% |
| Seminole | 0.0 /100 | #332 | Tragic 3.1% |
| Cajuns | 0.0 /100 | #333 | Tragic 3.1% |
| Cheyenne | 0.0 /100 | #334 | Tragic 3.1% |
| Navajo | 0.0 /100 | #335 | Tragic 3.1% |