German vs Immigrants from Eastern Africa Vision Disability
COMPARE
German
Immigrants from Eastern Africa
Vision Disability
Vision Disability Comparison
Germans
Immigrants from Eastern Africa
2.2%
VISION DISABILITY
13.4/ 100
METRIC RATING
208th/ 347
METRIC RANK
2.0%
VISION DISABILITY
97.0/ 100
METRIC RATING
89th/ 347
METRIC RANK
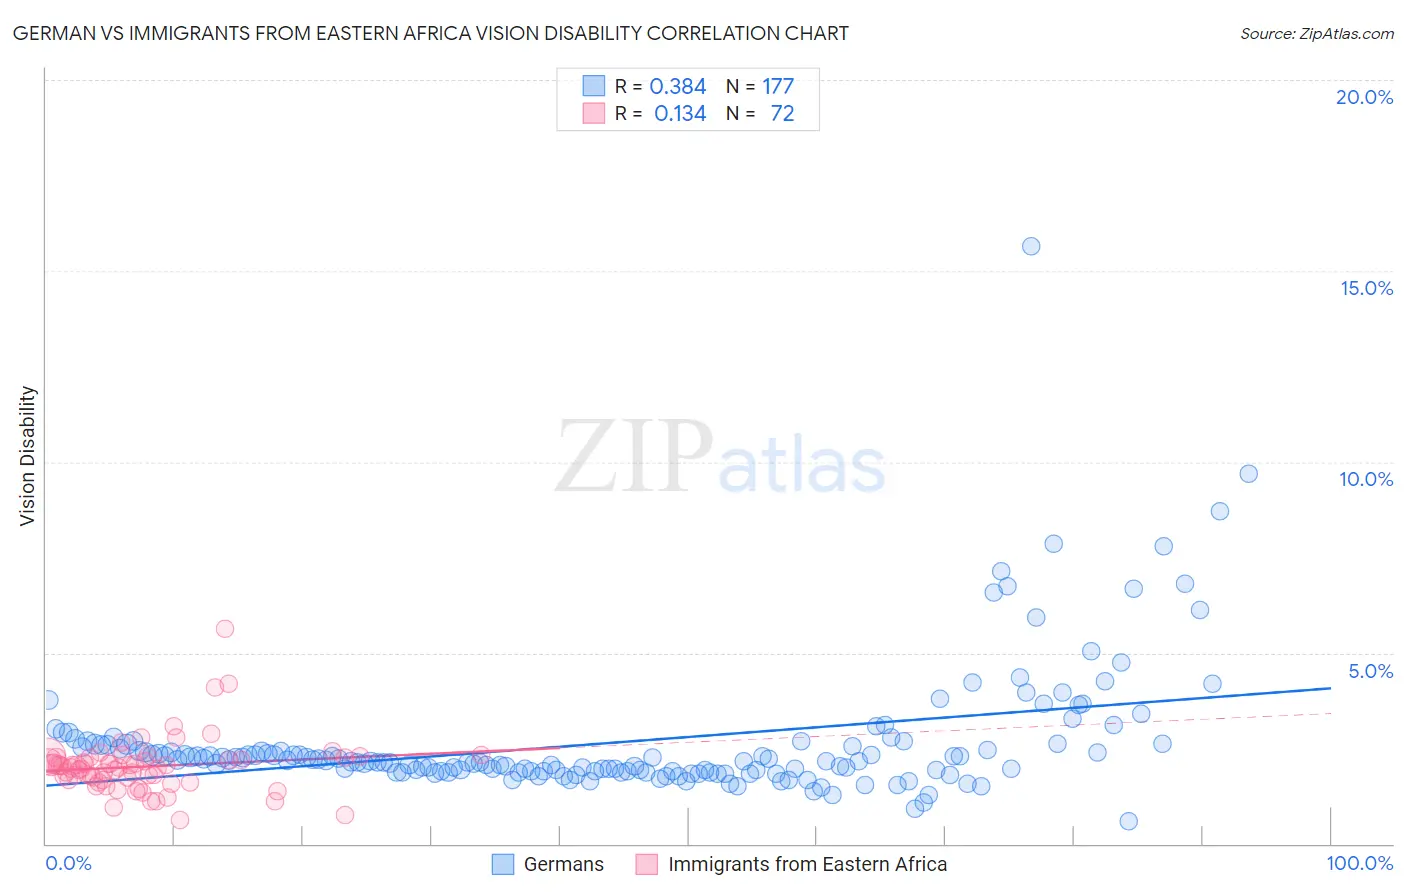
German vs Immigrants from Eastern Africa Vision Disability Correlation Chart
The statistical analysis conducted on geographies consisting of 578,195,961 people shows a mild positive correlation between the proportion of Germans and percentage of population with vision disability in the United States with a correlation coefficient (R) of 0.384 and weighted average of 2.2%. Similarly, the statistical analysis conducted on geographies consisting of 354,920,232 people shows a poor positive correlation between the proportion of Immigrants from Eastern Africa and percentage of population with vision disability in the United States with a correlation coefficient (R) of 0.134 and weighted average of 2.0%, a difference of 8.9%.
Vision Disability Correlation Summary
| Measurement | German | Immigrants from Eastern Africa |
| Minimum | 0.58% | 0.61% |
| Maximum | 15.7% | 5.6% |
| Range | 15.1% | 5.0% |
| Mean | 2.7% | 2.0% |
| Median | 2.2% | 2.0% |
| Interquartile 25% (IQ1) | 1.9% | 1.7% |
| Interquartile 75% (IQ3) | 2.6% | 2.2% |
| Interquartile Range (IQR) | 0.71% | 0.55% |
| Standard Deviation (Sample) | 1.7% | 0.73% |
| Standard Deviation (Population) | 1.7% | 0.73% |
Similar Demographics by Vision Disability
Demographics Similar to Germans by Vision Disability
In terms of vision disability, the demographic groups most similar to Germans are Immigrants from Nigeria (2.2%, a difference of 0.010%), Immigrants from Brazil (2.2%, a difference of 0.040%), Pennsylvania German (2.2%, a difference of 0.14%), Immigrants from Uruguay (2.2%, a difference of 0.27%), and Samoan (2.2%, a difference of 0.28%).
| Demographics | Rating | Rank | Vision Disability |
| Slovaks | 18.8 /100 | #201 | Poor 2.2% |
| Immigrants | Zaire | 18.0 /100 | #202 | Poor 2.2% |
| Dutch | 17.1 /100 | #203 | Poor 2.2% |
| Immigrants | Guyana | 15.9 /100 | #204 | Poor 2.2% |
| Samoans | 15.7 /100 | #205 | Poor 2.2% |
| Pennsylvania Germans | 14.5 /100 | #206 | Poor 2.2% |
| Immigrants | Nigeria | 13.5 /100 | #207 | Poor 2.2% |
| Germans | 13.4 /100 | #208 | Poor 2.2% |
| Immigrants | Brazil | 13.1 /100 | #209 | Poor 2.2% |
| Immigrants | Uruguay | 11.5 /100 | #210 | Poor 2.2% |
| Indonesians | 9.5 /100 | #211 | Tragic 2.2% |
| Bermudans | 9.0 /100 | #212 | Tragic 2.2% |
| Immigrants | Ghana | 8.9 /100 | #213 | Tragic 2.2% |
| Trinidadians and Tobagonians | 8.2 /100 | #214 | Tragic 2.2% |
| Nigerians | 7.2 /100 | #215 | Tragic 2.3% |
Demographics Similar to Immigrants from Eastern Africa by Vision Disability
In terms of vision disability, the demographic groups most similar to Immigrants from Eastern Africa are Norwegian (2.0%, a difference of 0.040%), Immigrants from Switzerland (2.0%, a difference of 0.050%), Immigrants from Moldova (2.0%, a difference of 0.11%), Chinese (2.0%, a difference of 0.14%), and Immigrants from Lebanon (2.1%, a difference of 0.14%).
| Demographics | Rating | Rank | Vision Disability |
| Immigrants | Poland | 97.6 /100 | #82 | Exceptional 2.0% |
| Immigrants | Western Asia | 97.5 /100 | #83 | Exceptional 2.0% |
| Immigrants | Latvia | 97.3 /100 | #84 | Exceptional 2.0% |
| Chinese | 97.2 /100 | #85 | Exceptional 2.0% |
| Immigrants | Moldova | 97.2 /100 | #86 | Exceptional 2.0% |
| Immigrants | Switzerland | 97.0 /100 | #87 | Exceptional 2.0% |
| Norwegians | 97.0 /100 | #88 | Exceptional 2.0% |
| Immigrants | Eastern Africa | 97.0 /100 | #89 | Exceptional 2.0% |
| Immigrants | Lebanon | 96.7 /100 | #90 | Exceptional 2.1% |
| Immigrants | Somalia | 96.2 /100 | #91 | Exceptional 2.1% |
| Immigrants | Syria | 96.2 /100 | #92 | Exceptional 2.1% |
| Immigrants | Europe | 96.1 /100 | #93 | Exceptional 2.1% |
| Immigrants | Croatia | 96.0 /100 | #94 | Exceptional 2.1% |
| Australians | 95.9 /100 | #95 | Exceptional 2.1% |
| Romanians | 95.7 /100 | #96 | Exceptional 2.1% |