German vs Immigrants from Iran Vision Disability
COMPARE
German
Immigrants from Iran
Vision Disability
Vision Disability Comparison
Germans
Immigrants from Iran
2.2%
VISION DISABILITY
13.4/ 100
METRIC RATING
208th/ 347
METRIC RANK
1.8%
VISION DISABILITY
100.0/ 100
METRIC RATING
6th/ 347
METRIC RANK
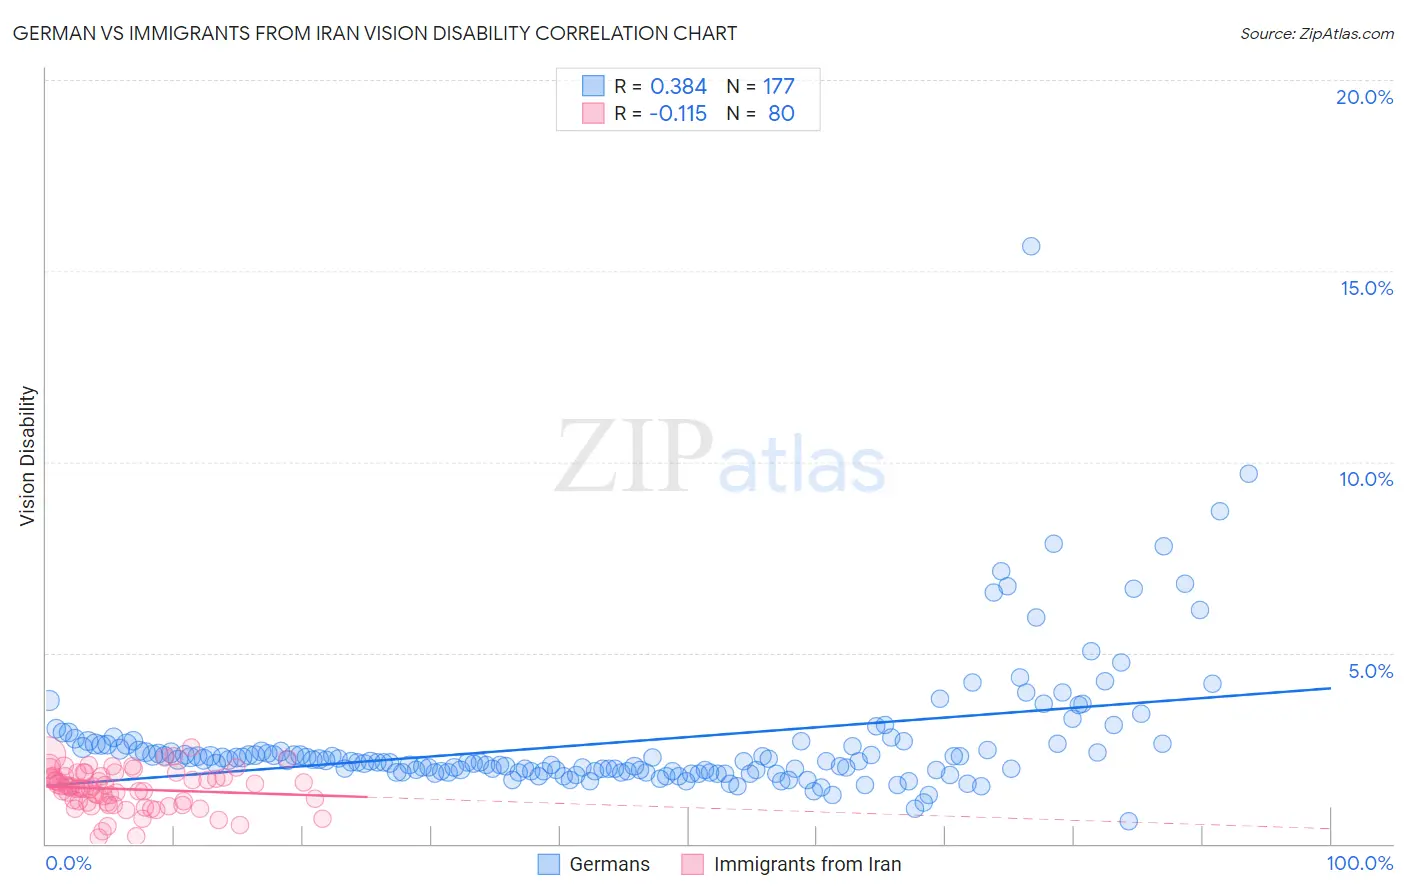
German vs Immigrants from Iran Vision Disability Correlation Chart
The statistical analysis conducted on geographies consisting of 578,195,961 people shows a mild positive correlation between the proportion of Germans and percentage of population with vision disability in the United States with a correlation coefficient (R) of 0.384 and weighted average of 2.2%. Similarly, the statistical analysis conducted on geographies consisting of 279,802,933 people shows a poor negative correlation between the proportion of Immigrants from Iran and percentage of population with vision disability in the United States with a correlation coefficient (R) of -0.115 and weighted average of 1.8%, a difference of 24.9%.
Vision Disability Correlation Summary
| Measurement | German | Immigrants from Iran |
| Minimum | 0.58% | 0.16% |
| Maximum | 15.7% | 2.5% |
| Range | 15.1% | 2.4% |
| Mean | 2.7% | 1.4% |
| Median | 2.2% | 1.5% |
| Interquartile 25% (IQ1) | 1.9% | 1.1% |
| Interquartile 75% (IQ3) | 2.6% | 1.8% |
| Interquartile Range (IQR) | 0.71% | 0.67% |
| Standard Deviation (Sample) | 1.7% | 0.50% |
| Standard Deviation (Population) | 1.7% | 0.50% |
Similar Demographics by Vision Disability
Demographics Similar to Germans by Vision Disability
In terms of vision disability, the demographic groups most similar to Germans are Immigrants from Nigeria (2.2%, a difference of 0.010%), Immigrants from Brazil (2.2%, a difference of 0.040%), Pennsylvania German (2.2%, a difference of 0.14%), Immigrants from Uruguay (2.2%, a difference of 0.27%), and Samoan (2.2%, a difference of 0.28%).
| Demographics | Rating | Rank | Vision Disability |
| Slovaks | 18.8 /100 | #201 | Poor 2.2% |
| Immigrants | Zaire | 18.0 /100 | #202 | Poor 2.2% |
| Dutch | 17.1 /100 | #203 | Poor 2.2% |
| Immigrants | Guyana | 15.9 /100 | #204 | Poor 2.2% |
| Samoans | 15.7 /100 | #205 | Poor 2.2% |
| Pennsylvania Germans | 14.5 /100 | #206 | Poor 2.2% |
| Immigrants | Nigeria | 13.5 /100 | #207 | Poor 2.2% |
| Germans | 13.4 /100 | #208 | Poor 2.2% |
| Immigrants | Brazil | 13.1 /100 | #209 | Poor 2.2% |
| Immigrants | Uruguay | 11.5 /100 | #210 | Poor 2.2% |
| Indonesians | 9.5 /100 | #211 | Tragic 2.2% |
| Bermudans | 9.0 /100 | #212 | Tragic 2.2% |
| Immigrants | Ghana | 8.9 /100 | #213 | Tragic 2.2% |
| Trinidadians and Tobagonians | 8.2 /100 | #214 | Tragic 2.2% |
| Nigerians | 7.2 /100 | #215 | Tragic 2.3% |
Demographics Similar to Immigrants from Iran by Vision Disability
In terms of vision disability, the demographic groups most similar to Immigrants from Iran are Immigrants from South Central Asia (1.8%, a difference of 0.060%), Iranian (1.8%, a difference of 0.21%), Okinawan (1.8%, a difference of 0.59%), Immigrants from Singapore (1.8%, a difference of 0.95%), and Immigrants from Hong Kong (1.8%, a difference of 1.1%).
| Demographics | Rating | Rank | Vision Disability |
| Immigrants | India | 100.0 /100 | #1 | Exceptional 1.7% |
| Filipinos | 100.0 /100 | #2 | Exceptional 1.7% |
| Immigrants | Taiwan | 100.0 /100 | #3 | Exceptional 1.7% |
| Thais | 100.0 /100 | #4 | Exceptional 1.7% |
| Okinawans | 100.0 /100 | #5 | Exceptional 1.8% |
| Immigrants | Iran | 100.0 /100 | #6 | Exceptional 1.8% |
| Immigrants | South Central Asia | 100.0 /100 | #7 | Exceptional 1.8% |
| Iranians | 100.0 /100 | #8 | Exceptional 1.8% |
| Immigrants | Singapore | 100.0 /100 | #9 | Exceptional 1.8% |
| Immigrants | Hong Kong | 100.0 /100 | #10 | Exceptional 1.8% |
| Immigrants | Israel | 100.0 /100 | #11 | Exceptional 1.8% |
| Immigrants | Korea | 100.0 /100 | #12 | Exceptional 1.8% |
| Immigrants | Eastern Asia | 100.0 /100 | #13 | Exceptional 1.8% |
| Immigrants | China | 100.0 /100 | #14 | Exceptional 1.8% |
| Immigrants | Bolivia | 100.0 /100 | #15 | Exceptional 1.8% |