German vs Immigrants from Central America Vision Disability
COMPARE
German
Immigrants from Central America
Vision Disability
Vision Disability Comparison
Germans
Immigrants from Central America
2.2%
VISION DISABILITY
13.4/ 100
METRIC RATING
208th/ 347
METRIC RANK
2.5%
VISION DISABILITY
0.0/ 100
METRIC RATING
285th/ 347
METRIC RANK
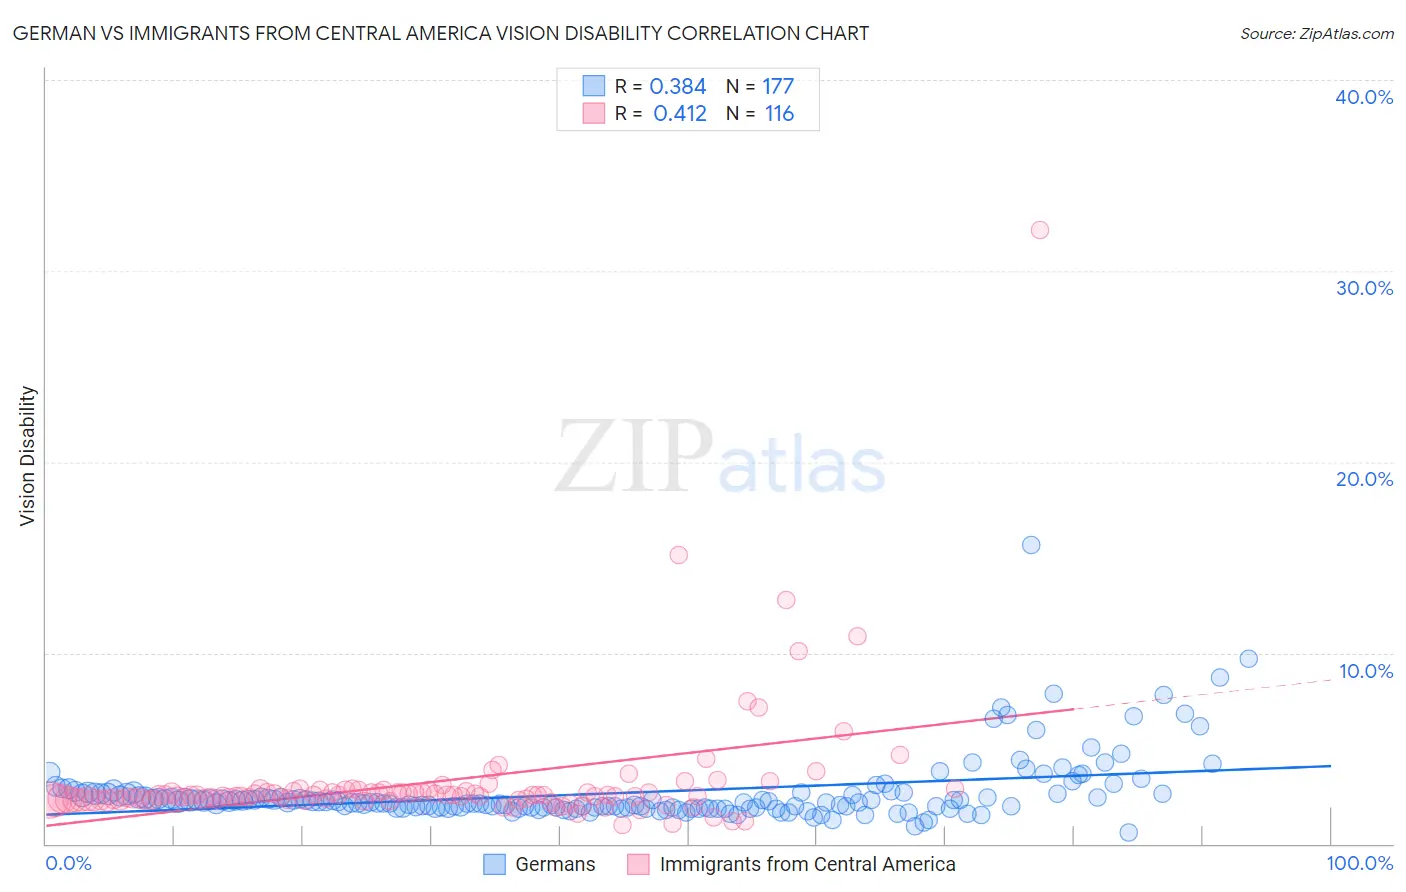
German vs Immigrants from Central America Vision Disability Correlation Chart
The statistical analysis conducted on geographies consisting of 578,195,961 people shows a mild positive correlation between the proportion of Germans and percentage of population with vision disability in the United States with a correlation coefficient (R) of 0.384 and weighted average of 2.2%. Similarly, the statistical analysis conducted on geographies consisting of 535,338,761 people shows a moderate positive correlation between the proportion of Immigrants from Central America and percentage of population with vision disability in the United States with a correlation coefficient (R) of 0.412 and weighted average of 2.5%, a difference of 10.6%.
Vision Disability Correlation Summary
| Measurement | German | Immigrants from Central America |
| Minimum | 0.58% | 1.00% |
| Maximum | 15.7% | 32.1% |
| Range | 15.1% | 31.1% |
| Mean | 2.7% | 3.2% |
| Median | 2.2% | 2.5% |
| Interquartile 25% (IQ1) | 1.9% | 2.3% |
| Interquartile 75% (IQ3) | 2.6% | 2.7% |
| Interquartile Range (IQR) | 0.71% | 0.43% |
| Standard Deviation (Sample) | 1.7% | 3.4% |
| Standard Deviation (Population) | 1.7% | 3.4% |
Similar Demographics by Vision Disability
Demographics Similar to Germans by Vision Disability
In terms of vision disability, the demographic groups most similar to Germans are Immigrants from Nigeria (2.2%, a difference of 0.010%), Immigrants from Brazil (2.2%, a difference of 0.040%), Pennsylvania German (2.2%, a difference of 0.14%), Immigrants from Uruguay (2.2%, a difference of 0.27%), and Samoan (2.2%, a difference of 0.28%).
| Demographics | Rating | Rank | Vision Disability |
| Slovaks | 18.8 /100 | #201 | Poor 2.2% |
| Immigrants | Zaire | 18.0 /100 | #202 | Poor 2.2% |
| Dutch | 17.1 /100 | #203 | Poor 2.2% |
| Immigrants | Guyana | 15.9 /100 | #204 | Poor 2.2% |
| Samoans | 15.7 /100 | #205 | Poor 2.2% |
| Pennsylvania Germans | 14.5 /100 | #206 | Poor 2.2% |
| Immigrants | Nigeria | 13.5 /100 | #207 | Poor 2.2% |
| Germans | 13.4 /100 | #208 | Poor 2.2% |
| Immigrants | Brazil | 13.1 /100 | #209 | Poor 2.2% |
| Immigrants | Uruguay | 11.5 /100 | #210 | Poor 2.2% |
| Indonesians | 9.5 /100 | #211 | Tragic 2.2% |
| Bermudans | 9.0 /100 | #212 | Tragic 2.2% |
| Immigrants | Ghana | 8.9 /100 | #213 | Tragic 2.2% |
| Trinidadians and Tobagonians | 8.2 /100 | #214 | Tragic 2.2% |
| Nigerians | 7.2 /100 | #215 | Tragic 2.3% |
Demographics Similar to Immigrants from Central America by Vision Disability
In terms of vision disability, the demographic groups most similar to Immigrants from Central America are Yakama (2.5%, a difference of 0.010%), Sioux (2.5%, a difference of 0.010%), Honduran (2.5%, a difference of 0.15%), French American Indian (2.5%, a difference of 0.18%), and Puget Sound Salish (2.5%, a difference of 0.30%).
| Demographics | Rating | Rank | Vision Disability |
| Spanish | 0.0 /100 | #278 | Tragic 2.4% |
| Nepalese | 0.0 /100 | #279 | Tragic 2.4% |
| Cape Verdeans | 0.0 /100 | #280 | Tragic 2.4% |
| U.S. Virgin Islanders | 0.0 /100 | #281 | Tragic 2.5% |
| Immigrants | Caribbean | 0.0 /100 | #282 | Tragic 2.5% |
| Puget Sound Salish | 0.0 /100 | #283 | Tragic 2.5% |
| Yakama | 0.0 /100 | #284 | Tragic 2.5% |
| Immigrants | Central America | 0.0 /100 | #285 | Tragic 2.5% |
| Sioux | 0.0 /100 | #286 | Tragic 2.5% |
| Hondurans | 0.0 /100 | #287 | Tragic 2.5% |
| French American Indians | 0.0 /100 | #288 | Tragic 2.5% |
| Immigrants | Nonimmigrants | 0.0 /100 | #289 | Tragic 2.5% |
| Immigrants | Cuba | 0.0 /100 | #290 | Tragic 2.5% |
| Immigrants | Honduras | 0.0 /100 | #291 | Tragic 2.5% |
| Crow | 0.0 /100 | #292 | Tragic 2.5% |