Immigrants from Croatia vs Yuman Vision Disability
COMPARE
Immigrants from Croatia
Yuman
Vision Disability
Vision Disability Comparison
Immigrants from Croatia
Yuman
2.1%
VISION DISABILITY
96.0/ 100
METRIC RATING
94th/ 347
METRIC RANK
3.0%
VISION DISABILITY
0.0/ 100
METRIC RATING
328th/ 347
METRIC RANK
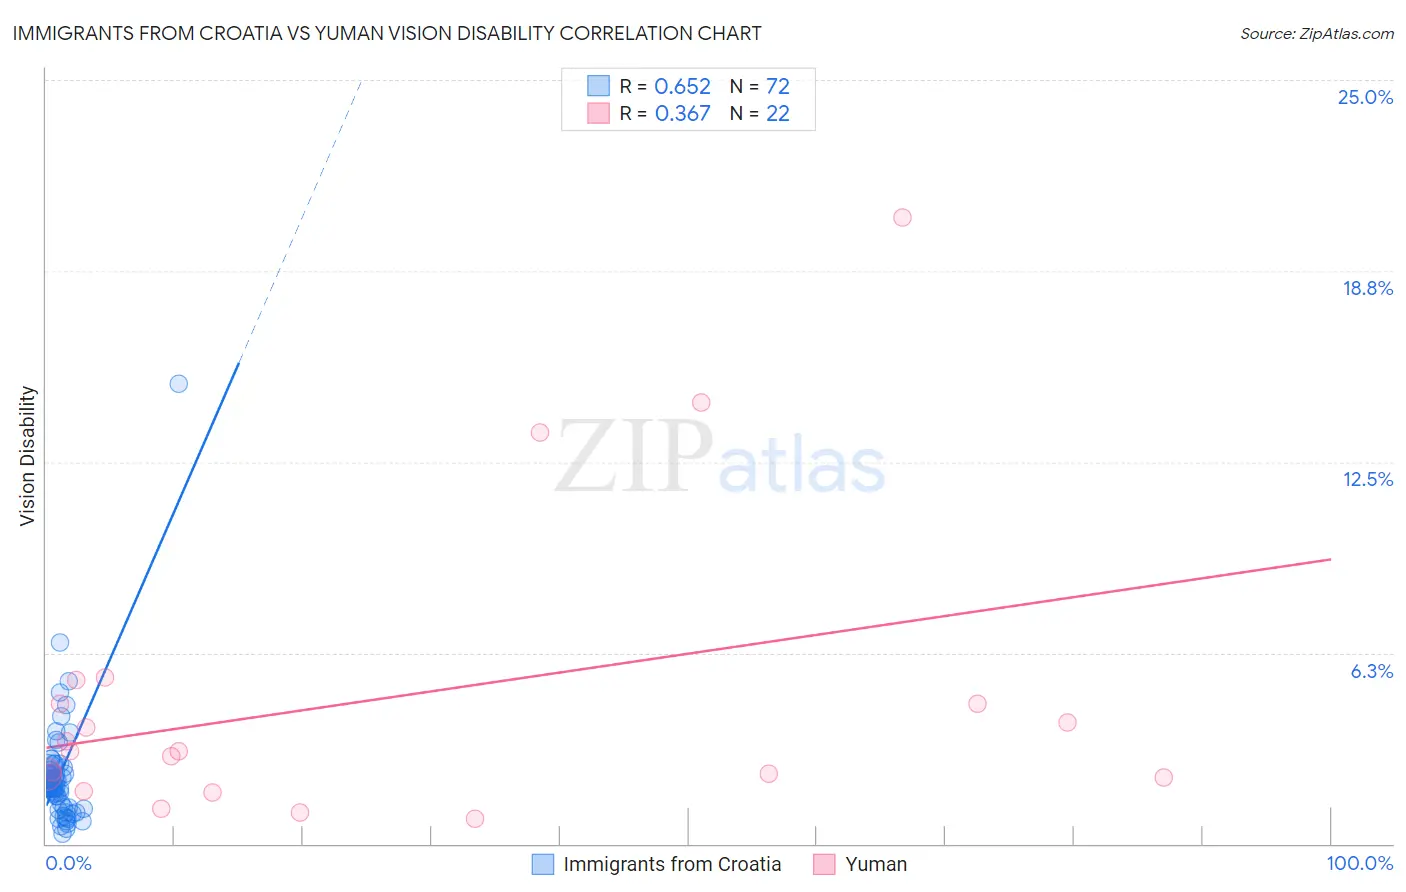
Immigrants from Croatia vs Yuman Vision Disability Correlation Chart
The statistical analysis conducted on geographies consisting of 132,552,000 people shows a significant positive correlation between the proportion of Immigrants from Croatia and percentage of population with vision disability in the United States with a correlation coefficient (R) of 0.652 and weighted average of 2.1%. Similarly, the statistical analysis conducted on geographies consisting of 40,661,627 people shows a mild positive correlation between the proportion of Yuman and percentage of population with vision disability in the United States with a correlation coefficient (R) of 0.367 and weighted average of 3.0%, a difference of 45.1%.
Vision Disability Correlation Summary
| Measurement | Immigrants from Croatia | Yuman |
| Minimum | 0.31% | 0.83% |
| Maximum | 15.1% | 20.5% |
| Range | 14.8% | 19.7% |
| Mean | 2.2% | 4.7% |
| Median | 1.9% | 3.0% |
| Interquartile 25% (IQ1) | 1.4% | 2.2% |
| Interquartile 75% (IQ3) | 2.3% | 4.6% |
| Interquartile Range (IQR) | 0.91% | 2.4% |
| Standard Deviation (Sample) | 1.9% | 5.0% |
| Standard Deviation (Population) | 1.9% | 4.9% |
Similar Demographics by Vision Disability
Demographics Similar to Immigrants from Croatia by Vision Disability
In terms of vision disability, the demographic groups most similar to Immigrants from Croatia are Immigrants from Europe (2.1%, a difference of 0.020%), Immigrants from Syria (2.1%, a difference of 0.070%), Australian (2.1%, a difference of 0.070%), Immigrants from Somalia (2.1%, a difference of 0.090%), and Romanian (2.1%, a difference of 0.13%).
| Demographics | Rating | Rank | Vision Disability |
| Immigrants | Switzerland | 97.0 /100 | #87 | Exceptional 2.0% |
| Norwegians | 97.0 /100 | #88 | Exceptional 2.0% |
| Immigrants | Eastern Africa | 97.0 /100 | #89 | Exceptional 2.0% |
| Immigrants | Lebanon | 96.7 /100 | #90 | Exceptional 2.1% |
| Immigrants | Somalia | 96.2 /100 | #91 | Exceptional 2.1% |
| Immigrants | Syria | 96.2 /100 | #92 | Exceptional 2.1% |
| Immigrants | Europe | 96.1 /100 | #93 | Exceptional 2.1% |
| Immigrants | Croatia | 96.0 /100 | #94 | Exceptional 2.1% |
| Australians | 95.9 /100 | #95 | Exceptional 2.1% |
| Romanians | 95.7 /100 | #96 | Exceptional 2.1% |
| Immigrants | Afghanistan | 95.6 /100 | #97 | Exceptional 2.1% |
| Immigrants | South Africa | 95.4 /100 | #98 | Exceptional 2.1% |
| Estonians | 95.3 /100 | #99 | Exceptional 2.1% |
| Greeks | 95.1 /100 | #100 | Exceptional 2.1% |
| Albanians | 94.9 /100 | #101 | Exceptional 2.1% |
Demographics Similar to Yuman by Vision Disability
In terms of vision disability, the demographic groups most similar to Yuman are Apache (3.0%, a difference of 0.19%), Native/Alaskan (3.0%, a difference of 0.54%), Spanish American (2.9%, a difference of 1.3%), Colville (3.0%, a difference of 1.4%), and Central American Indian (3.0%, a difference of 2.1%).
| Demographics | Rating | Rank | Vision Disability |
| Comanche | 0.0 /100 | #321 | Tragic 2.8% |
| Paiute | 0.0 /100 | #322 | Tragic 2.9% |
| Tlingit-Haida | 0.0 /100 | #323 | Tragic 2.9% |
| Hopi | 0.0 /100 | #324 | Tragic 2.9% |
| Cherokee | 0.0 /100 | #325 | Tragic 2.9% |
| Spanish Americans | 0.0 /100 | #326 | Tragic 2.9% |
| Natives/Alaskans | 0.0 /100 | #327 | Tragic 3.0% |
| Yuman | 0.0 /100 | #328 | Tragic 3.0% |
| Apache | 0.0 /100 | #329 | Tragic 3.0% |
| Colville | 0.0 /100 | #330 | Tragic 3.0% |
| Central American Indians | 0.0 /100 | #331 | Tragic 3.0% |
| Seminole | 0.0 /100 | #332 | Tragic 3.1% |
| Cajuns | 0.0 /100 | #333 | Tragic 3.1% |
| Cheyenne | 0.0 /100 | #334 | Tragic 3.1% |
| Navajo | 0.0 /100 | #335 | Tragic 3.1% |