Immigrants from Honduras vs Yuman Vision Disability
COMPARE
Immigrants from Honduras
Yuman
Vision Disability
Vision Disability Comparison
Immigrants from Honduras
Yuman
2.5%
VISION DISABILITY
0.0/ 100
METRIC RATING
291st/ 347
METRIC RANK
3.0%
VISION DISABILITY
0.0/ 100
METRIC RATING
328th/ 347
METRIC RANK
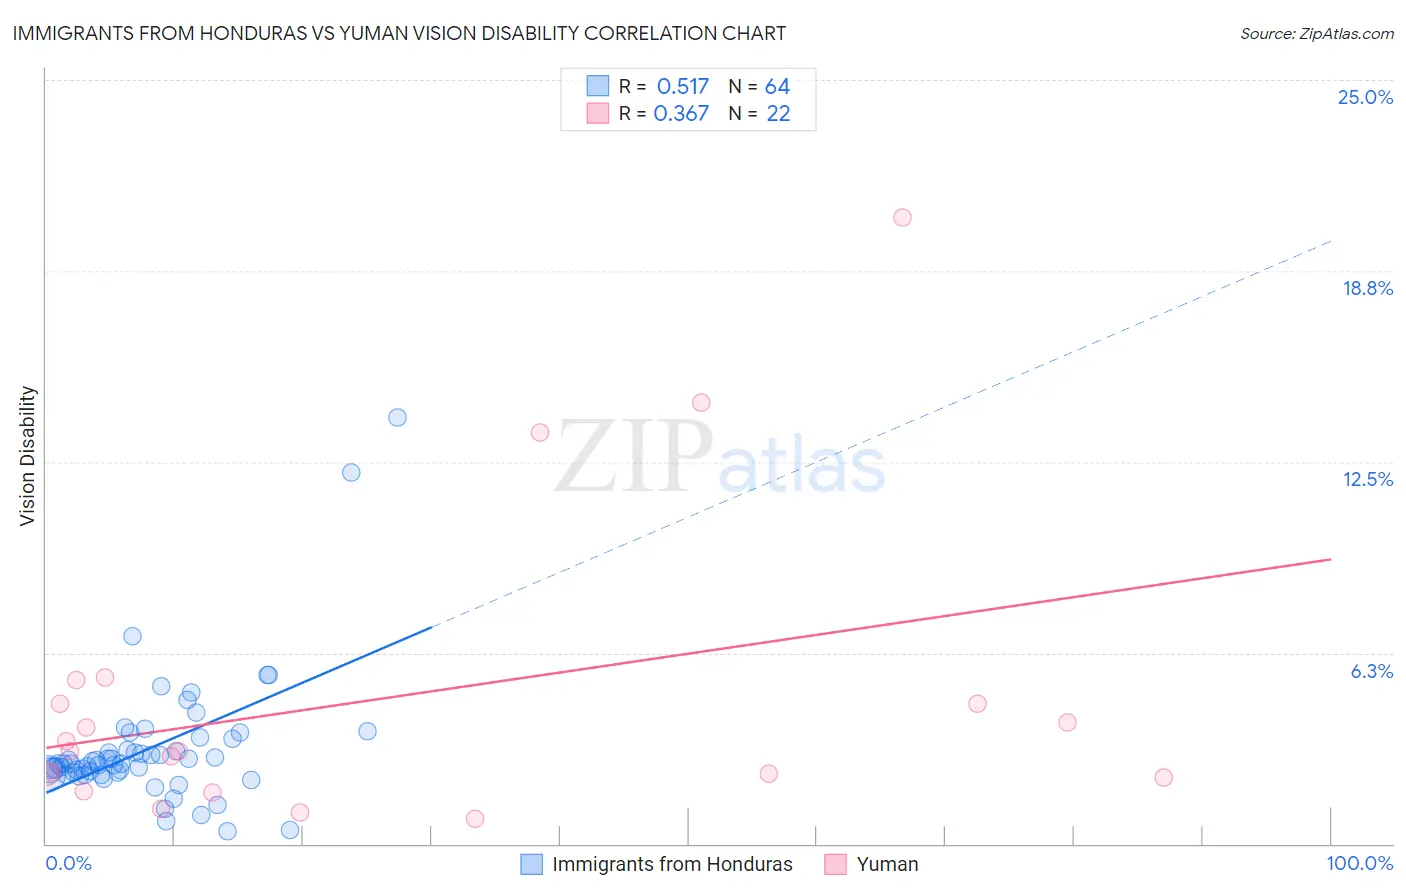
Immigrants from Honduras vs Yuman Vision Disability Correlation Chart
The statistical analysis conducted on geographies consisting of 322,475,782 people shows a substantial positive correlation between the proportion of Immigrants from Honduras and percentage of population with vision disability in the United States with a correlation coefficient (R) of 0.517 and weighted average of 2.5%. Similarly, the statistical analysis conducted on geographies consisting of 40,661,627 people shows a mild positive correlation between the proportion of Yuman and percentage of population with vision disability in the United States with a correlation coefficient (R) of 0.367 and weighted average of 3.0%, a difference of 19.7%.
Vision Disability Correlation Summary
| Measurement | Immigrants from Honduras | Yuman |
| Minimum | 0.42% | 0.83% |
| Maximum | 14.0% | 20.5% |
| Range | 13.5% | 19.7% |
| Mean | 3.1% | 4.7% |
| Median | 2.6% | 3.0% |
| Interquartile 25% (IQ1) | 2.3% | 2.2% |
| Interquartile 75% (IQ3) | 3.3% | 4.6% |
| Interquartile Range (IQR) | 0.94% | 2.4% |
| Standard Deviation (Sample) | 2.1% | 5.0% |
| Standard Deviation (Population) | 2.1% | 4.9% |
Similar Demographics by Vision Disability
Demographics Similar to Immigrants from Honduras by Vision Disability
In terms of vision disability, the demographic groups most similar to Immigrants from Honduras are Crow (2.5%, a difference of 0.10%), Yaqui (2.5%, a difference of 0.12%), Immigrants from Cuba (2.5%, a difference of 0.39%), Ottawa (2.5%, a difference of 0.46%), and Nonimmigrants (2.5%, a difference of 0.53%).
| Demographics | Rating | Rank | Vision Disability |
| Yakama | 0.0 /100 | #284 | Tragic 2.5% |
| Immigrants | Central America | 0.0 /100 | #285 | Tragic 2.5% |
| Sioux | 0.0 /100 | #286 | Tragic 2.5% |
| Hondurans | 0.0 /100 | #287 | Tragic 2.5% |
| French American Indians | 0.0 /100 | #288 | Tragic 2.5% |
| Immigrants | Nonimmigrants | 0.0 /100 | #289 | Tragic 2.5% |
| Immigrants | Cuba | 0.0 /100 | #290 | Tragic 2.5% |
| Immigrants | Honduras | 0.0 /100 | #291 | Tragic 2.5% |
| Crow | 0.0 /100 | #292 | Tragic 2.5% |
| Yaqui | 0.0 /100 | #293 | Tragic 2.5% |
| Ottawa | 0.0 /100 | #294 | Tragic 2.5% |
| Delaware | 0.0 /100 | #295 | Tragic 2.5% |
| Immigrants | Mexico | 0.0 /100 | #296 | Tragic 2.5% |
| Immigrants | Dominica | 0.0 /100 | #297 | Tragic 2.5% |
| Mexicans | 0.0 /100 | #298 | Tragic 2.5% |
Demographics Similar to Yuman by Vision Disability
In terms of vision disability, the demographic groups most similar to Yuman are Apache (3.0%, a difference of 0.19%), Native/Alaskan (3.0%, a difference of 0.54%), Spanish American (2.9%, a difference of 1.3%), Colville (3.0%, a difference of 1.4%), and Central American Indian (3.0%, a difference of 2.1%).
| Demographics | Rating | Rank | Vision Disability |
| Comanche | 0.0 /100 | #321 | Tragic 2.8% |
| Paiute | 0.0 /100 | #322 | Tragic 2.9% |
| Tlingit-Haida | 0.0 /100 | #323 | Tragic 2.9% |
| Hopi | 0.0 /100 | #324 | Tragic 2.9% |
| Cherokee | 0.0 /100 | #325 | Tragic 2.9% |
| Spanish Americans | 0.0 /100 | #326 | Tragic 2.9% |
| Natives/Alaskans | 0.0 /100 | #327 | Tragic 3.0% |
| Yuman | 0.0 /100 | #328 | Tragic 3.0% |
| Apache | 0.0 /100 | #329 | Tragic 3.0% |
| Colville | 0.0 /100 | #330 | Tragic 3.0% |
| Central American Indians | 0.0 /100 | #331 | Tragic 3.0% |
| Seminole | 0.0 /100 | #332 | Tragic 3.1% |
| Cajuns | 0.0 /100 | #333 | Tragic 3.1% |
| Cheyenne | 0.0 /100 | #334 | Tragic 3.1% |
| Navajo | 0.0 /100 | #335 | Tragic 3.1% |