Immigrants from Bosnia and Herzegovina vs Yuman Vision Disability
COMPARE
Immigrants from Bosnia and Herzegovina
Yuman
Vision Disability
Vision Disability Comparison
Immigrants from Bosnia and Herzegovina
Yuman
2.1%
VISION DISABILITY
81.5/ 100
METRIC RATING
145th/ 347
METRIC RANK
3.0%
VISION DISABILITY
0.0/ 100
METRIC RATING
328th/ 347
METRIC RANK
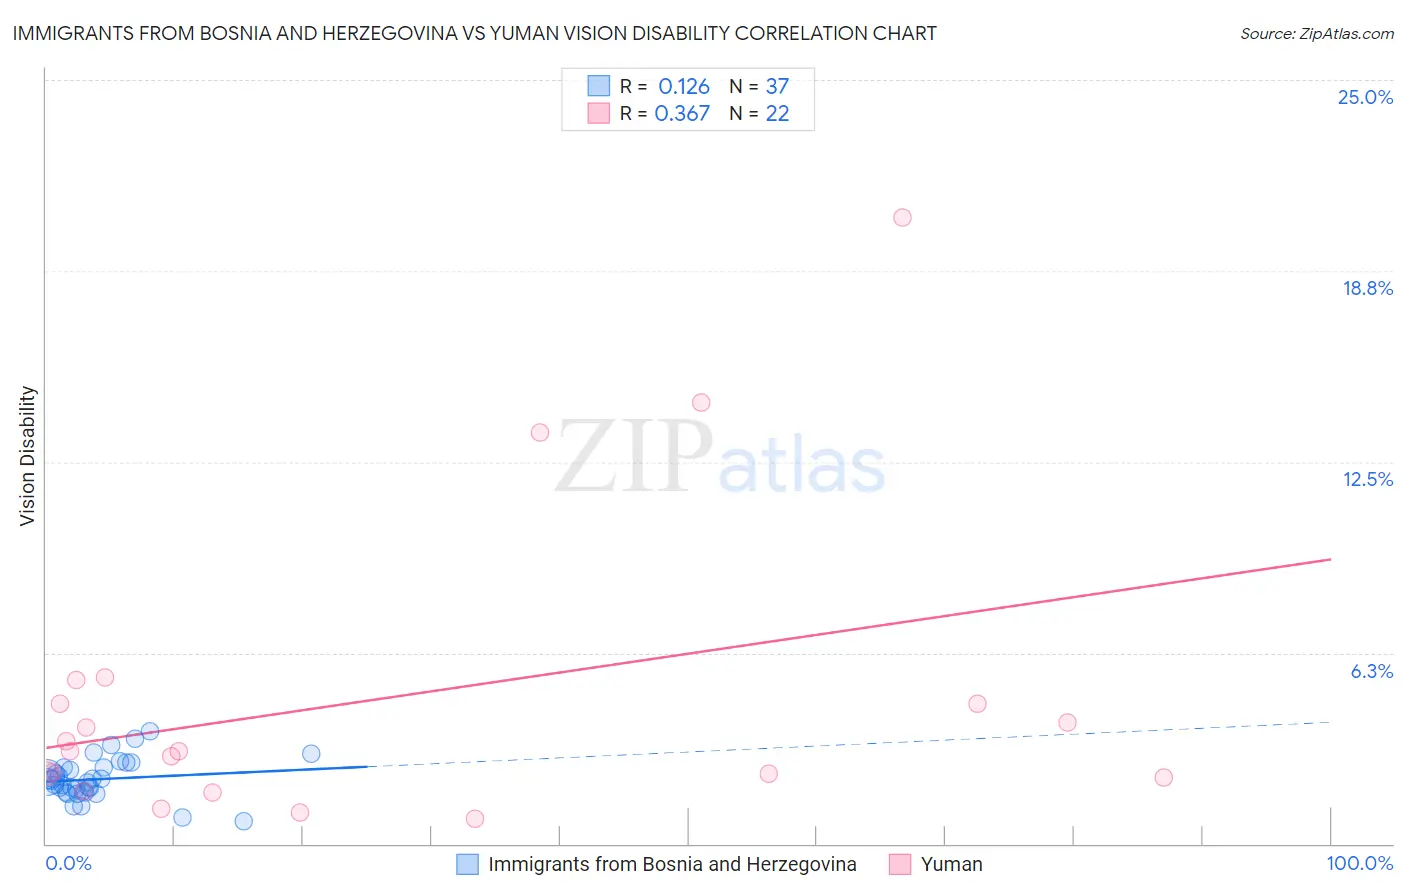
Immigrants from Bosnia and Herzegovina vs Yuman Vision Disability Correlation Chart
The statistical analysis conducted on geographies consisting of 156,802,362 people shows a poor positive correlation between the proportion of Immigrants from Bosnia and Herzegovina and percentage of population with vision disability in the United States with a correlation coefficient (R) of 0.126 and weighted average of 2.1%. Similarly, the statistical analysis conducted on geographies consisting of 40,661,627 people shows a mild positive correlation between the proportion of Yuman and percentage of population with vision disability in the United States with a correlation coefficient (R) of 0.367 and weighted average of 3.0%, a difference of 41.1%.
Vision Disability Correlation Summary
| Measurement | Immigrants from Bosnia and Herzegovina | Yuman |
| Minimum | 0.75% | 0.83% |
| Maximum | 3.7% | 20.5% |
| Range | 2.9% | 19.7% |
| Mean | 2.1% | 4.7% |
| Median | 2.1% | 3.0% |
| Interquartile 25% (IQ1) | 1.7% | 2.2% |
| Interquartile 75% (IQ3) | 2.5% | 4.6% |
| Interquartile Range (IQR) | 0.80% | 2.4% |
| Standard Deviation (Sample) | 0.64% | 5.0% |
| Standard Deviation (Population) | 0.64% | 4.9% |
Similar Demographics by Vision Disability
Demographics Similar to Immigrants from Bosnia and Herzegovina by Vision Disability
In terms of vision disability, the demographic groups most similar to Immigrants from Bosnia and Herzegovina are Ukrainian (2.1%, a difference of 0.040%), South American (2.1%, a difference of 0.15%), Immigrants from Sierra Leone (2.1%, a difference of 0.15%), Italian (2.1%, a difference of 0.18%), and Sierra Leonean (2.1%, a difference of 0.30%).
| Demographics | Rating | Rank | Vision Disability |
| Arabs | 86.3 /100 | #138 | Excellent 2.1% |
| Immigrants | Morocco | 85.2 /100 | #139 | Excellent 2.1% |
| Immigrants | Netherlands | 84.2 /100 | #140 | Excellent 2.1% |
| Sierra Leoneans | 84.1 /100 | #141 | Excellent 2.1% |
| South Americans | 82.8 /100 | #142 | Excellent 2.1% |
| Immigrants | Sierra Leone | 82.8 /100 | #143 | Excellent 2.1% |
| Ukrainians | 81.9 /100 | #144 | Excellent 2.1% |
| Immigrants | Bosnia and Herzegovina | 81.5 /100 | #145 | Excellent 2.1% |
| Italians | 79.7 /100 | #146 | Good 2.1% |
| Immigrants | Sudan | 78.4 /100 | #147 | Good 2.1% |
| Finns | 78.3 /100 | #148 | Good 2.1% |
| Colombians | 76.2 /100 | #149 | Good 2.1% |
| Belgians | 75.9 /100 | #150 | Good 2.1% |
| Immigrants | Norway | 75.5 /100 | #151 | Good 2.1% |
| Immigrants | Southern Europe | 74.6 /100 | #152 | Good 2.1% |
Demographics Similar to Yuman by Vision Disability
In terms of vision disability, the demographic groups most similar to Yuman are Apache (3.0%, a difference of 0.19%), Native/Alaskan (3.0%, a difference of 0.54%), Spanish American (2.9%, a difference of 1.3%), Colville (3.0%, a difference of 1.4%), and Central American Indian (3.0%, a difference of 2.1%).
| Demographics | Rating | Rank | Vision Disability |
| Comanche | 0.0 /100 | #321 | Tragic 2.8% |
| Paiute | 0.0 /100 | #322 | Tragic 2.9% |
| Tlingit-Haida | 0.0 /100 | #323 | Tragic 2.9% |
| Hopi | 0.0 /100 | #324 | Tragic 2.9% |
| Cherokee | 0.0 /100 | #325 | Tragic 2.9% |
| Spanish Americans | 0.0 /100 | #326 | Tragic 2.9% |
| Natives/Alaskans | 0.0 /100 | #327 | Tragic 3.0% |
| Yuman | 0.0 /100 | #328 | Tragic 3.0% |
| Apache | 0.0 /100 | #329 | Tragic 3.0% |
| Colville | 0.0 /100 | #330 | Tragic 3.0% |
| Central American Indians | 0.0 /100 | #331 | Tragic 3.0% |
| Seminole | 0.0 /100 | #332 | Tragic 3.1% |
| Cajuns | 0.0 /100 | #333 | Tragic 3.1% |
| Cheyenne | 0.0 /100 | #334 | Tragic 3.1% |
| Navajo | 0.0 /100 | #335 | Tragic 3.1% |