French vs Immigrants from China Cognitive Disability
COMPARE
French
Immigrants from China
Cognitive Disability
Cognitive Disability Comparison
French
Immigrants from China
17.0%
COGNITIVE DISABILITY
90.0/ 100
METRIC RATING
139th/ 347
METRIC RANK
16.9%
COGNITIVE DISABILITY
94.9/ 100
METRIC RATING
121st/ 347
METRIC RANK
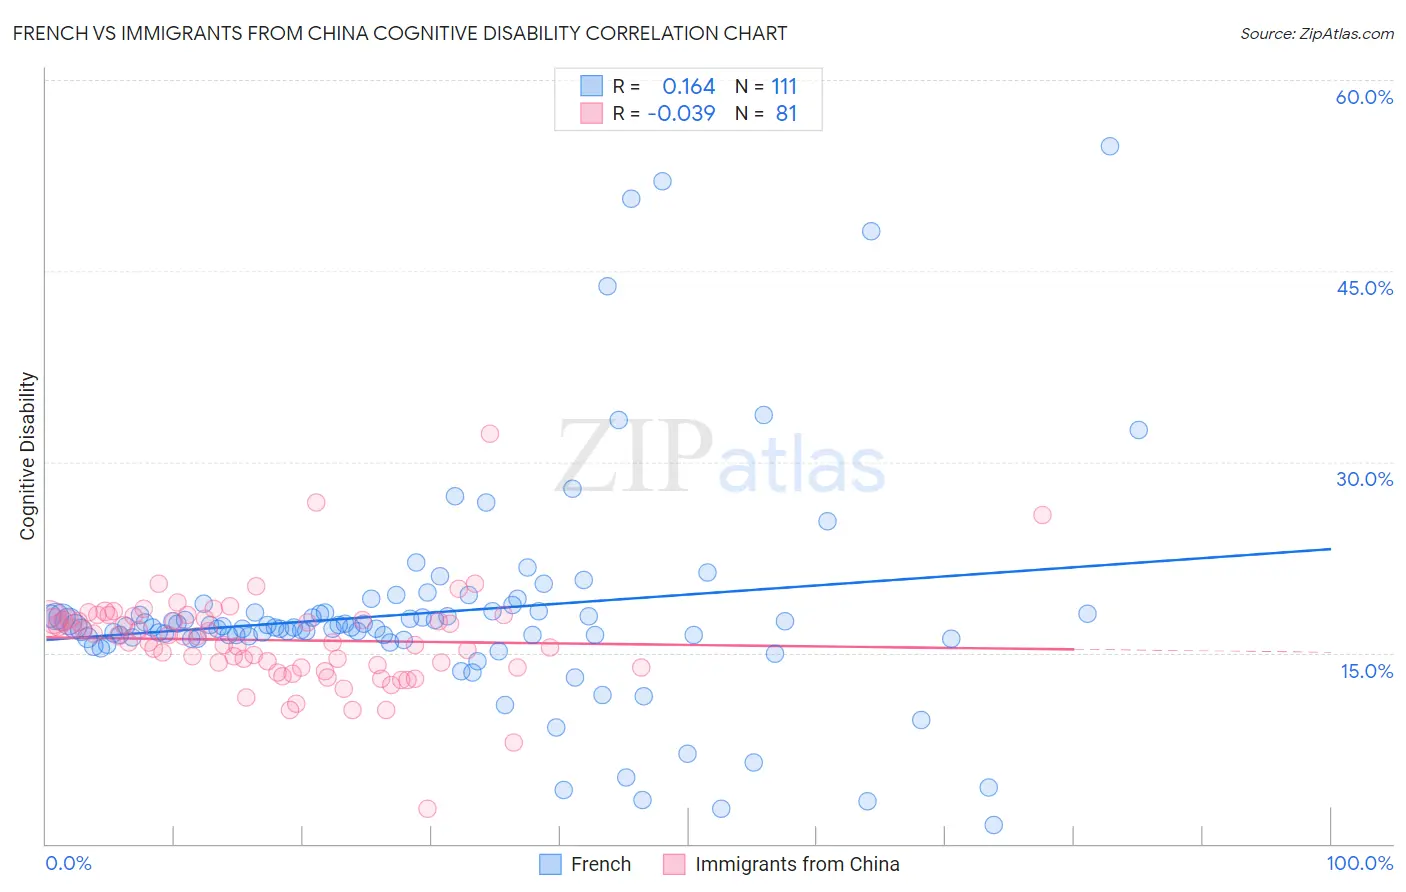
French vs Immigrants from China Cognitive Disability Correlation Chart
The statistical analysis conducted on geographies consisting of 572,255,575 people shows a poor positive correlation between the proportion of French and percentage of population with cognitive disability in the United States with a correlation coefficient (R) of 0.164 and weighted average of 17.0%. Similarly, the statistical analysis conducted on geographies consisting of 457,042,790 people shows no correlation between the proportion of Immigrants from China and percentage of population with cognitive disability in the United States with a correlation coefficient (R) of -0.039 and weighted average of 16.9%, a difference of 0.53%.
Cognitive Disability Correlation Summary
| Measurement | French | Immigrants from China |
| Minimum | 1.5% | 2.8% |
| Maximum | 54.8% | 32.2% |
| Range | 53.3% | 29.4% |
| Mean | 18.2% | 16.0% |
| Median | 17.0% | 16.3% |
| Interquartile 25% (IQ1) | 16.1% | 13.9% |
| Interquartile 75% (IQ3) | 18.2% | 17.7% |
| Interquartile Range (IQR) | 2.1% | 3.8% |
| Standard Deviation (Sample) | 8.8% | 3.8% |
| Standard Deviation (Population) | 8.7% | 3.8% |
Demographics Similar to French and Immigrants from China by Cognitive Disability
In terms of cognitive disability, the demographic groups most similar to French are Chilean (17.0%, a difference of 0.0%), Welsh (17.0%, a difference of 0.070%), Immigrants from Norway (17.0%, a difference of 0.080%), Israeli (17.0%, a difference of 0.090%), and Lebanese (17.0%, a difference of 0.11%). Similarly, the demographic groups most similar to Immigrants from China are Scottish (16.9%, a difference of 0.020%), Immigrants from Western Europe (16.9%, a difference of 0.020%), Portuguese (16.9%, a difference of 0.030%), Turkish (16.9%, a difference of 0.050%), and Scandinavian (16.9%, a difference of 0.10%).
| Demographics | Rating | Rank | Cognitive Disability |
| Scottish | 95.0 /100 | #120 | Exceptional 16.9% |
| Immigrants | China | 94.9 /100 | #121 | Exceptional 16.9% |
| Immigrants | Western Europe | 94.8 /100 | #122 | Exceptional 16.9% |
| Portuguese | 94.7 /100 | #123 | Exceptional 16.9% |
| Turks | 94.5 /100 | #124 | Exceptional 16.9% |
| Scandinavians | 94.1 /100 | #125 | Exceptional 16.9% |
| Europeans | 93.4 /100 | #126 | Exceptional 17.0% |
| Immigrants | Costa Rica | 93.1 /100 | #127 | Exceptional 17.0% |
| Nicaraguans | 93.0 /100 | #128 | Exceptional 17.0% |
| Immigrants | Uruguay | 92.9 /100 | #129 | Exceptional 17.0% |
| Immigrants | Vietnam | 92.4 /100 | #130 | Exceptional 17.0% |
| Immigrants | Germany | 92.1 /100 | #131 | Exceptional 17.0% |
| Whites/Caucasians | 92.1 /100 | #132 | Exceptional 17.0% |
| Immigrants | Jordan | 91.9 /100 | #133 | Exceptional 17.0% |
| Immigrants | Chile | 91.7 /100 | #134 | Exceptional 17.0% |
| Lebanese | 91.3 /100 | #135 | Exceptional 17.0% |
| Israelis | 91.0 /100 | #136 | Exceptional 17.0% |
| Immigrants | Norway | 90.9 /100 | #137 | Exceptional 17.0% |
| Welsh | 90.8 /100 | #138 | Exceptional 17.0% |
| French | 90.0 /100 | #139 | Excellent 17.0% |
| Chileans | 89.9 /100 | #140 | Excellent 17.0% |